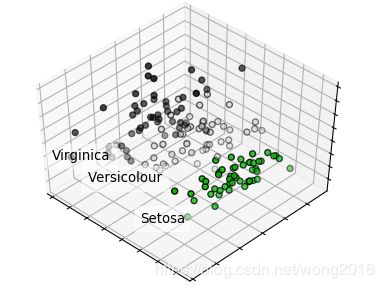
【Python实例第26讲】一个主成分的例子
机器学习训练营——机器学习爱好者的自由交流空间(入群联系qq:2279055353)
主成分(PCA)是一种重要的数据降维技术。PCA位于scikit-learn的decomposition模块里。在这个例子里,我们演示如何在Iris数据集上应用主成分。
实例代码
首先,加载必需的库。
import numpy as np
import matplotlib.pyplot as plt
from mpl_toolkits.mplot3d import Axes3D


from sklearn import decomposition
from sklearn import datasets
导入datasets库的iris数据集,它是由3个类别组成的。
np.random.seed(5)

centers = [[1, 1], [-1, -1], [1, -1]]
iris = datasets.load_iris()
X = iris.data
y = iris.target

fig = plt.figure(1, figsize=(4, 3))
plt.clf()
ax = Axes3D(fig, rect=[0, 0, .95, 1], elev=48, azim=134)
将特征压缩到3个主成分。
plt.cla()
pca = decomposition.PCA(n_components=3)
pca.fit(X)
X = pca.transform(X)

for name, label in [('Setosa', 0), ('Versicolour', 1), ('Virginica', 2)]:
    ax.text3D(X[y == label, 0].mean(),
              X[y == label, 1].mean() + 1.5,
              X[y == label, 2].mean(), name,
              horizontalalignment='center',
              bbox=dict(alpha=.5, edgecolor='w', facecolor='w'))
重新排序标签,用不同的颜色标记不同的类别结果。
# Reorder the labels to have colors matching the cluster results
y = np.choose(y, [1, 2, 0]).astype(np.float)
ax.scatter(X[:, 0], X[:, 1], X[:, 2], c=y, cmap=plt.cm.nipy_spectral,
           edgecolor='k')

ax.w_xaxis.set_ticklabels([])
ax.w_yaxis.set_ticklabels([])
ax.w_zaxis.set_ticklabels([])

plt.show()
阅读更多精彩内容,请关注微信公众号:统计学习与大数据
