Prometheus在Linux(Redhat/Debian)上使用容器Docker方式本地部署
Prometheus简介
Prometheus是一个开源的系统监控和报警的工具包,最初由SoundCloud发布,后经过开源社区慢慢发展壮大。其本身并不具备监控功能,
但是依靠其周边组件而具备强大的监控功能。可以对服务器硬件,系统,应用以及容器进行监控告警。
Prometheus的主要特点有:
多维数据模型(有metric名称和键值对确定的时间序列)
灵活的查询语言
不依赖分布式存储
通过pull方式采集时间序列,通过http协议传输
支持通过中介网关的push时间序列的方式
监控数据通过服务或者静态配置来发现
支持图表和dashboard等多种方式
Prometheus包含多个组件,其中有许多是可选的:
Prometheus主服务器,用来收集和存储时间序列数据
应用程序client代码库
短时jobs的push gateway
基于Rails/SQL的GUI dashboard
特殊用途的exporter(包括HAProxy、StatsD、Ganglia等)
用于报警的alertmanager
命令行工具查询
cadvisor用来收集容器信息
依赖Docker
Debian上安装docker
1:apt-get remove docker docker-engine docker.io
2:apt-get update
3:apt-get install apt-transport-https ca-certificates curl software-properties-common
4:curl -fsSL https://download.docker.com/linux/ubuntu/gpg | sudo apt-key add -
5:apt-key fingerprint 0EBFCD88
6:add-apt-repository “deb [arch=amd64] https://download.docker.com/linux/ubuntu \ $(lsb_release -cs) \ stable”
7:apt-get update
8:apt-get install docker-ce
9:systemctl start docker
或者Redhat安装docker
1:yum -y install docker-ce
2:systemctl start docker
安装Node Exporter 来收集硬件信息
1:执行docker命令安装exporter
docker run -d -p 9100:9100 \
  -v "/proc:/host/proc" \
  -v "/sys:/host/sys" \
  -v "/:/rootfs" \
  --net=host \
  prom/node-exporter \
  --path.procfs /host/proc \
  --path.sysfs /host/sys \
  --collector.filesystem.ignored-mount-points "^/(sys|proc|dev|host|etc)($|/)"
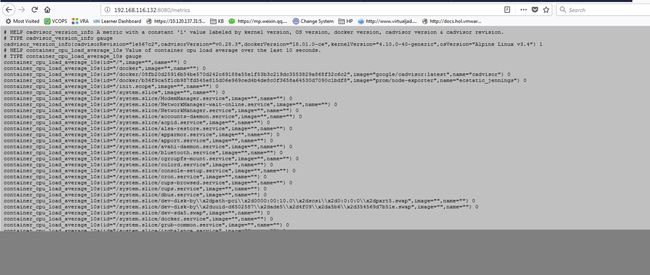
2: Node Exporter 启动后,将通过 9100 提供 host 的监控数据。在浏览器中通过 http://ip:9100/metrics 测试一下

安装cAdvisor 来收集容器信息
1:执行docker命令安装cadvisor
docker run \
    --volume=/:/rootfs:ro \
    --volume=/var/run:/var/run:rw \
    --volume=/sys:/sys:ro \
    --volume=/var/lib/docker/:/var/lib/docker:ro \
    --publish=8080:8080 \
    --detach=true \
    --name=cadvisor \
    --net=host \
    google/cadvisor:latest
2:cAdvisor 启动后,将通过 8080 提供 host 的监控数据。在浏览器中通过 http://ip:8080/metrics 测试一下
部署prometheus容器服务
1:添加配置文件,注意修改 scrape_configs字段下targets部分,可添加多节点监控。
touch /root/prometheus.yml
# my global config
global:
  scrape_interval:     15s # Set the scrape interval to every 15 seconds. Default is every 1 minute.
  evaluation_interval: 15s # Evaluate rules every 15 seconds. The default is every 1 minute.
  # scrape_timeout is set to the global default (10s).
# Alertmanager configuration
alerting:
  alertmanagers:
  - static_configs:
    - targets:
      # - alertmanager:9093

# Load rules once and periodically evaluate them according to the global 'evaluation_interval'.
rule_files:
  # - "first_rules.yml"
  # - "second_rules.yml"

# A scrape configuration containing exactly one endpoint to scrape:
# Here it's Prometheus itself.


scrape_configs:
  # The job name is added as a label `job=` to any timeseries scraped from this config.
  - job_name: 'prometheus'
    # metrics_path defaults to '/metrics'
    # scheme defaults to 'http'.
    static_configs:
      - targets: ['localhost:9090','localhost:8080','localhost:9100']
2:安装prometheus
docker run -d -p 9090:9090 \
    -v /root/prometheus.yml:/etc/prometheus/prometheus.yml \
    --name prometheus \
    --net=host \
    prom/prometheus
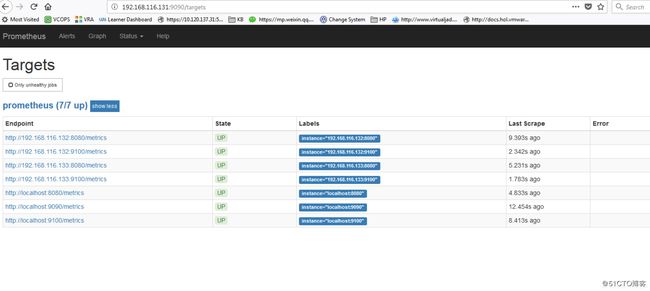
3:安装完毕后浏览器中打开http://ip:9090 点击菜单 status ----> target,状态显示为up,说明普罗米修斯服务能够正常获取监控数据,点击endpoint可以查看收集的详细信息。
prometheus结合grafana提供图形展示
首先安装好grafana,运行起来后用户名密码admin/admin:
docker run -d \
  -p 3000:3000 \
  -e "GF_SECURITY_ADMIN_PASSWORD=admin" \
  -v ~/grafana_db:/var/lib/grafana grafana/grafana:5.0.0
1:添加prometheus的数据源
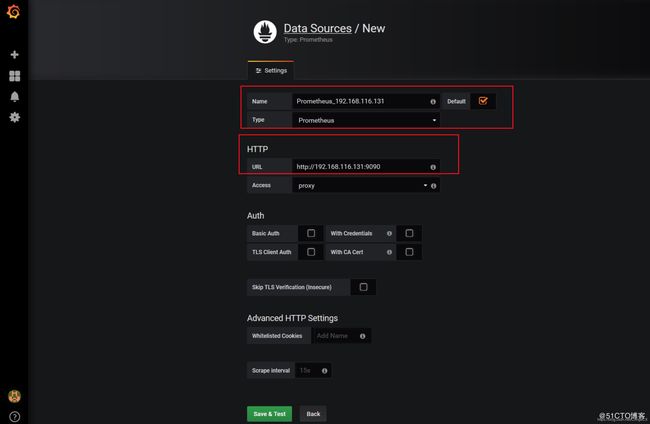
2:点击Save & Test 如果一切顺利该DataSource可以正常工作了,也就是说Grafana可以正常跟Prometheus正常通信了。grafana通过dashboard来展示数据图形,grafana官网上已经有大量的dashboard模板可提供使用,访问 https://grafana.com/dashboards?dataSource=prometheus&search=docker将会看到很多的dashboard模板

3:有些dashboard可以下载后直接导入,而有些需要修改后再导入,需要看dashboard的overview
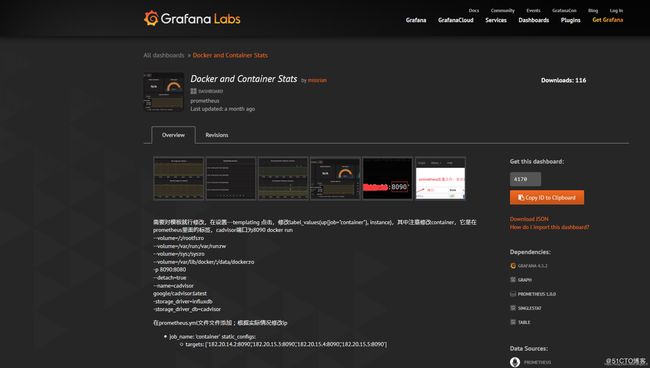
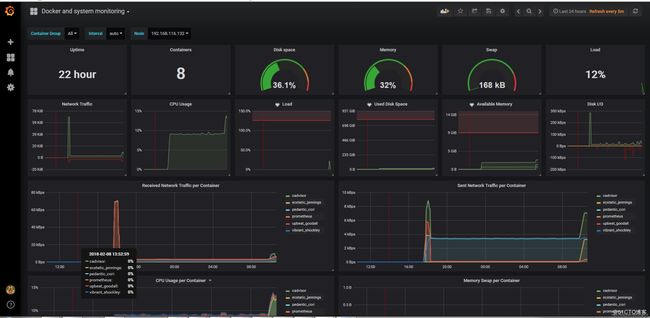
4:例如导入Docker and system monitoring dashboard
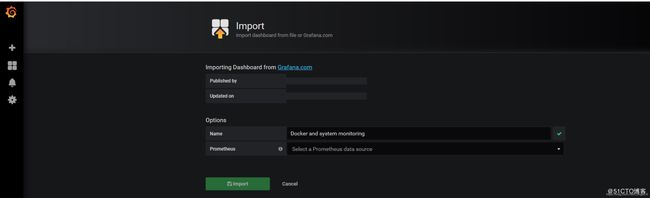
5:需要等一段时间,将会呈现如下的画面,通过监控数据转换来的服务器以及容器监控图表