Linux调试器-gdb的使用
GDB是GNU开源组织发布的一个强大的UNIX下的程序调试工具。
一般来说,GDB主要完成下面四个方面的功能:
1、启动你的程序,可以按照你的自定义的要求随心所欲的运行程序。
2、可让被调试的程序在你所指定的调置的断点处停住。(断点可以是条件表达式)
3、当程序被停住时,可以检查此时你的程序中所发生的事。
4、动态的改变你程序的执行环境。
list/l 行号:显示binFile源代码,接着上次的位置往下列,每次列10行
list/l 函数名:列出某个函数的源代码
s或step:进入函数调用 breaktrace
bt:查看各级函数调用及参数
info(i) locals:查看当前栈帧局部变量的值
info break :查看断点信息。
finish:执行到当前函数返回,然后挺下来等待命令
print(p):打印表达式的值,通过表达式可以修改变量的值或者调用函数
set var:修改变量的值
quit:退出gdb
break(b) 行号:在某一行设置断点 break
函数名:在某个函数开头设置断点
continue(或c):从当前位置开始连续而非单步执行程序
run(或r):从开始连续而非单步执行程序
delete breakpoints:删除所有断点
delete breakpoints n:删除序号为n的断点
disable breakpoints:禁用断点
enable breakpoints:启用断点
info(或i) breakpoints:参看当前设置了哪些断点
display 变量名:跟踪查看一个变量,每次停下来都显示它的值
undisplay:取消对先前设置的那些变量的跟踪
until X行号:跳至X行
p 变量:打印变量值
n 或 next:单条执行
二、一个简单测试实例
#include

int func(int n){
  int sum=0,i;
for(i=0;i [root@localhost ~]# gcc -g test.c -o test <-------编译生成执行文件
[root@localhost ~]# gdb test <----------启动GDB
GNU gdb (GDB) Red Hat Enterprise Linux (7.2-92.el6)
Copyright (C) 2010 Free Software Foundation, Inc.
License GPLv3+: GNU GPL version 3 or later
This is free software: you are free to change and redistribute it.
There is NO WARRANTY, to the extent permitted by law. Type "show copying"
and "show warranty" for details.
This GDB was configured as "i686-redhat-linux-gnu".
For bug reporting instructions, please see:
Reading symbols from /root/test...done.
(gdb) l <------------- l命令相当于list,从第一行开始列出原码
3int func(int n){
4int sum=0,i;
5for(i=0;i
6sum+=i;
7}
8return sum;
9}
10
11int main(){
12int i=0;
(gdb) <---------------直接回车表示,重复上一次命令
13int ret=0;
14for(;i<10;i++){
15ret+=i;
16}
17printf("ret=%d\n",ret);
18printf("sum(5)=:%d\n",func(5));
19return 0;
20}
(gdb) break 12 <--------------设置断点,在源程序第12行处
Breakpoint 1 at 0x80483fa: file test.c, line 12.
(gdb) break func <----------------设置断点,在函数func()入口处
Breakpoint 2 at 0x80483ca: file test.c, line 4.
(gdb) info break <----------------查看断点信息
Num Type Disp Enb Address What
1 breakpoint keep y 0x080483fa in main at test.c:12
2 breakpoint keep y 0x080483ca in func at test.c:4
(gdb) r <---------------运行程序,run命令简写
Starting program: /root/test
Breakpoint 1, main () at test.c:12 <----------在断点处停住
12int i=0;
Missing separate debuginfos, use: debuginfo-install glibc-2.12-1.132.el6.i686
(gdb) n <---------------单条语句执行,next命令简写
13int ret=0;
(gdb) n
14for(;i<10;i++){
(gdb) n
15ret+=i;
(gdb) n
14for(;i<10;i++){
(gdb) c <----------------继续运行程序,continue命令简写
Continuing.
ret=45 <----------程序输出
Breakpoint 2, func (n=5) at test.c:4
4int sum=0,i;
(gdb) n
5for(i=0;i
(gdb) p i <-------------打印变量i的值,print命令简写
$1 = 6406132
(gdb) n
6sum+=i;
(gdb) n
5for(i=0;i
(gdb) p sum
$2 = 0
(gdb) n
6sum+=i;
(gdb) p i
$3 = 1
(gdb) n
5for(i=0;i
(gdb) p sum
$4 = 1
(gdb) bt <-----------查看函数堆栈
#0 func (n=5) at test.c:5
#1 0x08048441 in main () at test.c:18
(gdb) finish <-----------------退出函数
Run till exit from #0 func (n=5) at test.c:5
0x08048441 in main () at test.c:18
18printf("sum(5)=:%d\n",func(5));
Value returned is $5 = 10
(gdb) c <-------------继续运行
Continuing.
sum(5)=:10 <----------程序输出
Program exited normally.
(gdb) q <---------------退出gdb
如果没有-g,你将看不见程序的函数名、变量名,所代替的全是运行时的内存地址。当你用-g把调试信息加入之后,并成功编译目标代码以后,让我们来看看如何用gdb来调试:
启动GDB的方法:
1、gdb
program也就是你的执行文件,一般在当前目录下。
用gdb同时调试一个运行程序和core文件,core是程序非法执行后core dump后产生的文件。
set var:修改变量的值(var为变量)
delete breakpoint s:删除序号为n的断点
disable breakpoints:禁用断点
enable breakpoints:启用断点
info breakpoints:查看当前设置了哪些断点
until X行号:调至X行
#include
#include
#include
#include

int main(){
   pid_t pid=fork();

   if(pid==-1){
       perror("fork error");
       return -1;
   }
   else if(pid==0){  //child
       printf("i am a child:my pid is %d,my father is %d\n",getpid(),getppi    d());
   }
   else  //father
   {
       printf("i am a father:my pid is %d\n",getpid());
       wait(NULL);
   }
   return 0;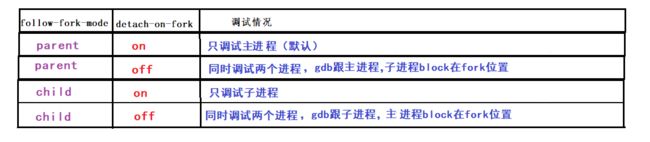
} 了解一下这两个值的取值:
[root@localhost ~]# gcc -g test.c -o test <-------记得一定加上-g选项
[root@localhost ~]# gdb test <-------进入gdb调试模式
GNU gdb (GDB) Red Hat Enterprise Linux (7.2-92.el6) <---版本大于7.0
Copyright (C) 2010 Free Software Foundation, Inc.
License GPLv3+: GNU GPL version 3 or later
This is free software: you are free to change and redistribute it.
There is NO WARRANTY, to the extent permitted by law. Type "show copying"
and "show warranty" for details.
This GDB was configured as "i686-redhat-linux-gnu".
For bug reporting instructions, please see:
Reading symbols from /root/test...done.
(gdb) show follow-fork-mode <-----查看系统默认的follow-fork-mode和detach-on-fork
Debugger response to a program call of fork or vfork is "parent".
(gdb) show detach-on-fork
Whether gdb will detach the child of a fork is on.
(gdb) set follow-fork-mode child <------设置follow-fork-mode和detach-on-fork
(gdb) set detach-on-fork off
(gdb) show follow-fork-mode <---------再次查看follow-fork-mode和detach-on-fork
Debugger response to a program call of fork or vfork is "child". <-----设置成功
(gdb) show detach-on-fork
Whether gdb will detach the child of a fork is off.
(gdb) l <--------查看源代码(list)
1#include
2#include
3#include
4#include
5
6int main(){
7pid_t pid=fork();
8
9if(pid==-1){
10perror("fork error");
(gdb)
11return -1;
12}
13else if(pid==0){ //child
14printf("i am a child:my pid is %d,my father is %d\n",getpid(),getppid());
15}
16else //father
17{
18printf("i am a father:my pid is %d\n",getpid());
19wait(NULL);
20}
(gdb) <------回车下一页
21return 0;
22}
23
24
25//int func(int n){
26//int sum=0,i;
27//for(i=0;i
28//sum+=i;
29//}
30//return sum;
(gdb) b 14 <--------设置断点
Breakpoint 1 at 0x80484e8: file test.c, line 14.
(gdb) b 18
Breakpoint 2 at 0x804850b: file test.c, line 18.
(gdb) r <-------运行程序
Starting program: /root/test
[New process 3034]
Missing separate debuginfos, use: debuginfo-install glibc-2.12-1.132.el6.i686
[Switching to process 3034]
Breakpoint 1, main () at test.c:14
14printf("i am a child:my pid is %d,my father is %d\n",getpid(),getppid());
Missing separate debuginfos, use: debuginfo-install glibc-2.12-1.132.el6.i686
(gdb) info inferiors <---------查询正在调试的进程
Num Description Executable
* 2 process 3034 /root/test <-----带’*’为正在调试的进程
1 process 3031 /root/test
(gdb) inferior 1 <--------切换调试的进程,切换到进程1
[Switching to inferior 1 [process 3031] (/root/test)]
[Switching to thread 1 (process 3031)]
#0 0x00110424 in __kernel_vsyscall ()
(gdb) info inferiors <----------再次查询正在调试的进程
Num Description Executable
2 process 3034 /root/test
* 1 process 3031 /root/test <--------切换到了进程1
(gdb)
2、还有其他的一些命令:
(1)add-inferior [-copies n] [-exec executable]添加新的调试进程,可以用file executable来分配给inferior可执行文件。
(2)remove-inferiors infno删除一个infno号的inferior。如果inferior正在运行,则不能删除,所以删除前需要先kill或者detach这个inferior。
(3)clone-inferior [-copies n] [infno] (4)detach inferiordetach掉编号是infno的inferior。注意这个inferior还存在,可以再次用run命令执行它。
(5)kill inferior infno:kill掉infno号inferior。注意这个inferior仍然存在,可以再次用run等命令执行它。
(6)set schedule-multipleon|off
设为off:只有当前inferior会执行。 设为on:全部是执行状态的inferior都会执行。 这个选项类似于多线程调试里的set .
(7)scheduler-locking 注意:如果scheduler-locking是指为on,即使schedule-multiple设置为on,也只有当前进程的当前线程会执行。
show schedule-multiple: 查看schedule-multiple的状态。
(8)set follow-exec-mode new|same 设置same:当发生exec的时候,在执行exec的inferior上控制子进程。
设置为new:新建一个inferior给执行起来的子进程。而父进程的inferior仍然保留,当前保留的inferior的程序状态是没有执行。
(9)set print inferior-events on|off用来打开和关闭inferior状态的提示信息。
show print inferior-events查看print inferior-events设置的状态。
(10)maint info program-spaces用来显示当前GDB一共管理了多少地址空间
#include
#include

void* thread1(void* arg){
     printf("i am thread1,my tid is %u\n",pthread_self());
     return NULL;
}
void* thread2(void* arg){
    printf("i am thread2,my tid is %u\n",pthread_self());
return NULL;
 }

 int main(){
    pthread_t tid1,tid2;
    pthread_create(&tid1,NULL,thread1,NULL);
    pthread_create(&tid2,NULL,thread2,NULL);

    pthread_join(tid1,NULL);
    pthread_join(tid2,NULL);

    return 0;
 }
以上代码中,主线程main创建了两个子线程分别是thread1和thread2,所以线程的总数为3个。
GDB默认支持调试多线程,跟主线程,子线程block在create thread。
[root@localhost ~]# gcc -g test.c -o test -lpthread <-------记得一定加上-g选项
[root@localhost ~]# gdb test <-------进入gdb调试模式
GNU gdb (GDB) Red Hat Enterprise Linux (7.2-92.el6)
Copyright (C) 2010 Free Software Foundation, Inc.
License GPLv3+: GNU GPL version 3 or later
This is free software: you are free to change and redistribute it.
There is NO WARRANTY, to the extent permitted by law. Type "show copying"
and "show warranty" for details.
This GDB was configured as "i686-redhat-linux-gnu".
For bug reporting instructions, please see:
Reading symbols from /root/test...done.
(gdb) b 19 <--------设置断点,此时已经创建了线程
Breakpoint 1 at 0x804856b: file test.c, line 19.
(gdb) r <--------运行
Starting program: /root/test
[Thread debugging using libthread_db enabled]
[New Thread 0xb7ff0b70 (LWP 3699)]
i am thread1,my tid is 3086945136
[New Thread 0xb75efb70 (LWP 3700)]
Breakpoint 1, main () at test.c:19
19 pthread_join(tid1,NULL);
Missing separate debuginfos, use: debuginfo-install glibc-2.12-1.132.el6.i686
(gdb) info threads <--------显示可以调试的所有线程
3 Thread 0xb75efb70 (LWP 3700) 0x0056bd58 in clone () from /lib/libc.so.6
2 Thread 0xb7ff0b70 (LWP 3699) (Exiting) 0x00626d91 in __nptl_death_event ()
from /lib/libpthread.so.0
* 1 Thread 0xb7ff16c0 (LWP 3696) main () at test.c:19
(gdb) thread 2 <--------切换当前调试的线程为指定2的线程
[Switching to thread 2 (Thread 0xb7ff0b70 (LWP 3699))]#0 0x00626d91 in __nptl_death_event () from /lib/libpthread.so.0
(gdb) info threads <-----观察结果,切换成功
3 Thread 0xb75efb70 (LWP 3700) 0x0056bd58 in clone () from /lib/libc.so.6
* 2 Thread 0xb7ff0b70 (LWP 3699) (Exiting) 0x00626d91 in __nptl_death_event ()
from /lib/libpthread.so.0
1 Thread 0xb7ff16c0 (LWP 3696) main () at test.c:19
(gdb)
(3)break FileName.cpp:LinuNum thread all:
所有线程都在文件FileName.cpp的第LineNum行有断点。
(4)thread apply ID1 ID2 IDN command:
让线程编号是ID1,ID2…等等的线程都执行command命令。
(5)thread apply all command:所有线程都执行command命令。
(6)set scheduler-locking off|on|step:
在调式某一个线程时,其他线程是否执行。在使用step或continue命令调试当前被调试线程的时候,其他线程也是同时执行的,如果我们只想要被调试的线程执行,而其他线程停止等待,那就要锁定要调试的线程,只让他运行。
(7)off:不锁定任何线程,默认值。on:锁定其他线程,只有当前线程执行。
(8)step:在step(单步)时,只有被调试线程运行。
(9)set non-stop on/off:
当调式一个线程时,其他线程是否运行。
(10)set pagination on/off:
在使用backtrace时,在分页时是否停止。
(11)set target-async on/ff:
同步和异步。同步,gdb在输出提示符之前等待程序报告一些线程已经终止的信息。而异步的则是直接返回。
(12)show scheduler-locking:
查看当前锁定线程的模式