Python读取pcd点云文件
关于Kinect采集点云数据,可以参考https://blog.csdn.net/qq_35565669/article/details/106627639
有两种方法读取pcd文件,使用Python的库open3d读取,或者直接当做txt文件读取,然后python处理数据
目录
open3d读取点云
python直接读取
open3d读取点云
import open3d as o3d
import numpy as np
def read_pcd(file_path):
	pcd = o3d.io.read_point_cloud(file_path)
	print(np.asarray(pcd.points))
	colors = np.asarray(pcd.colors) * 255
	points = np.asarray(pcd.points)
	print(points.shape, colors.shape)
	return np.concatenate([points, colors], axis=-1)
注意读取的点云三维坐标和颜色是分开的,分别是points和colors,而且colors中的RGB数据是归一化的,所以要乘以255.
读取的结果为
[[  0.49283338   1.870551     3.8150003  106.         112.
  128.        ]
 [  0.50465167   1.8759862    3.8260002  129.         133.
  149.        ]
 [  0.51545358   1.8775003    3.8290002  138.         141.
  155.        ]
 [  0.52380067   1.8701893    3.8140001  142.         144.
  155.        ]
 [  0.53598863   1.8766096    3.8270001  148.         150.
  161.        ]
 [  0.5481053    1.8825409    3.8390002  157.         161.
  172.        ]
 [  0.55548692   1.8722914    3.8180001  156.         160.
  170.        ]
 [  0.57120341   1.8899956    3.8540001  159.         163.
  173.        ]
 [  0.57821184   1.8787676    3.8310001  160.         164.
  174.        ]
 [  0.59047383   1.8847055    3.8430002  161.         165.
  175.        ]]
python直接读取
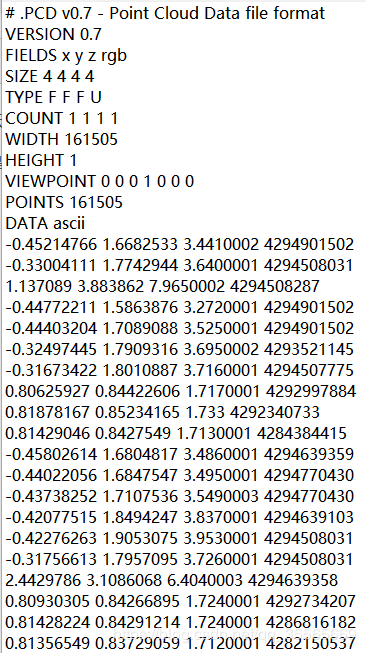
因为Kinect的使用是用C++,而当对点云数据进行处理时,使用Python比较方便。pcd文件其实就是一个txt文件,里面存储了点云信息,包括点云的数目,点云的类型(是pointxyz还是pointxyzrgb),还有点云的宽度和高度。
这里使用的点云文件存储的点是pointxyzrgb类型,每个点存储了xyz坐标信息,还有argb信息。可以看到下图里三个浮点数就是xyz坐标了,后面的4294901502是一个32位数,argb每个通道对应了8位。要注意的是,透明度a是在RGB前面的,一般是255,所以可以看到argb的二进制数都很大。
先读取一下点云的大小,然后对每行数据处理,把每行的xyzrgba存进一个列表,最后转为numpy数组就行了。
def load_pcd_data(file_path):
	pts = []
	f = open(file_path, 'r')
	data = f.readlines()

	f.close()
	line = data[9]
	# print line
	line = line.strip('\n')
	i = line.split(' ')
	pts_num = eval(i[-1])
	for line in data[11:]:
		line = line.strip('\n')
		xyzargb = line.split(' ')
		x, y, z = [eval(i) for i in xyzargb[:3]]
		argb = xyzargb[-1]
		# print type(bgra)
		argb = bin(eval(argb))[2:]
		a, r, g, b = [int(argb[8 * i:8 * i + 8], 2) for i in range(4)]
		pts.append([x, y, z, a, r, g, b])

	assert len(pts) == pts_num
	res = np.zeros((pts_num, len(pts[0])), dtype=np.float)
	for i in range(pts_num):
		res[i] = pts[i]
	# x = np.zeros([np.array(t) for t in pts])
	return res
最后读取的效果为
[[  0.49283338   1.870551     3.8150003  255.         106.
  112.         128.        ]
 [  0.50465167   1.8759862    3.8260002  255.         129.
  133.         149.        ]
 [  0.51545358   1.8775003    3.8290002  255.         138.
  141.         155.        ]
 [  0.52380067   1.8701893    3.8140001  255.         142.
  144.         155.        ]
 [  0.53598863   1.8766096    3.8270001  255.         148.
  150.         161.        ]
 [  0.5481053    1.8825409    3.8390002  255.         157.
  161.         172.        ]
 [  0.55548692   1.8722914    3.8180001  255.         156.
  160.         170.        ]
 [  0.57120341   1.8899956    3.8540001  255.         159.
  163.         173.        ]
 [  0.57821184   1.8787676    3.8310001  255.         160.
  164.         174.        ]
 [  0.59047383   1.8847055    3.8430002  255.         161.
  165.         175.        ]]
可以看出与第一种方法读取的结果相同,这验证了第二种方法的正确性。
