详细的python basemap中各函数的所有参量注释
所有函数的参量在另一篇文章中
#!/usr/bin/env python3
# -*- coding: utf-8 -*-
"""
Created on Fri Dec 8 22:22:53 2017
@author: chenze
"""
import matplotlib.pyplot as plt
import numpy as np
from mpl_toolkits.basemap import Basemap
from netCDF4 import Dataset as ncfile
'''
path1='/home/chenze/practice/'
nc=ncfile(path1+'nws_precip_1day_20171203_netcdf/nws_precip_1day_20171130_conus.nc','r')
print(nc)
data=nc.variables['observation']
obs=data[:]
print(obs)
'''
m=Basemap(projection='mill',lon_0=-105.,lat_0=90.,lat_ts=60.,\
llcrnrlat=25.,urcrnrlat=50.,\
llcrnrlon=-118.,urcrnrlon=-60.,\
rsphere=6371200.,resolution='l',area_thresh=10000)
#m.drawcounties() 这是啥?
'''m.drawcounties(linewidth=0.1, linestyle='solid', color='k',\
antialiased=1, facecolor='none', ax=None, zorder=None, drawbounds=False)
#Draw county boundaries in US. The county boundary shapefile originates with
# the NOAA Coastal Geospatial Data Project
'''
m.drawcountries(linewidth=3.0,color='k')
'''
m.drawcountries(linewidth=0.5, linestyle='solid', color='k',\
antialiased=1, ax=None, zorder=None)'''
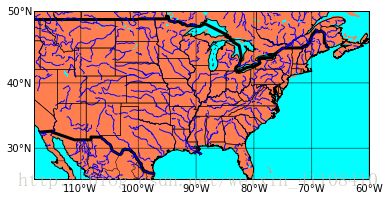
m.drawcoastlines()
'''底图图1()
m.drawcoastlines(linewidth=1.0, linestyle='solid', color='k',\
antialiased=1, ax=None, zorder=None)
--->>>画地图轮廓线'''
m.drawlsmask(land_color='coral',ocean_color='aqua')#陆地,海洋的颜色
'''底图(2) --->填充海洋陆地颜色
m.drawlsmask(land_color='0.8', ocean_color='w', lsmask=None,\
lsmask_lons=None, lsmask_lats=None, lakes=True, resolution='l',\
grid=5, **kwargs)
# Draw land-sea mask image.
'''
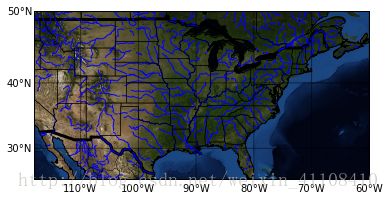
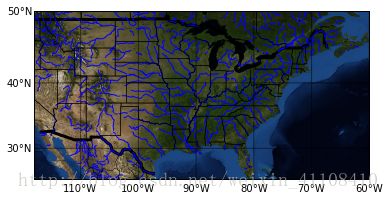
#m.bluemarble()
'''底图(3)Draw the NASA ‘Blue Marble’ image '''
m.drawmapboundary(color='k', linewidth=1.0, fill_color=None, zorder=None, ax=None)
# draw boundary around map projection region, optionally filling interior of region.
m.drawrivers(linewidth=1.0, linestyle='solid', color='b', antialiased=1,\
ax=None, zorder=None)
# Draw major rivers.
m.drawstates(linewidth=0.5, linestyle='solid', color='k', antialiased=1, \
ax=None, zorder=None)# Draw state boundaries in Americas.
#m.fillcontinents
'''m.fillcontinents(color='0.8', lake_color=None, ax=None, zorder=None, alpha=None)'''
# Fill continents.
'''
m. drawmapscale(lon, lat, lon0, lat0, length, barstyle='simple',\
units='km', fontsize=9, yoffset=None, labelstyle='simple',\
fontcolor='k', fillcolor1='w', fillcolor2='k', ax=None, format='%d', \
zorder=None, linecolor=None, linewidth=None)
# Draw a map scale at lon,lat of length length representing distance in the map projection coordinates at lon0,lat0
'''
# draw parallels.
parallels = np.arange(0.,90,10.)
m.drawparallels(parallels,labels=[1,0,0,0],fontsize=10)
# draw meridians
meridians = np.arange(180.,360.,10.)
m.drawmeridians(meridians,labels=[0,0,0,1],fontsize=10)
'''
drawmeridians(meridians, color='k', textcolor='k', linewidth=1.0,\
zorder=None, dashes=[1, 1], labels=[0, 0, 0, 0], labelstyle=None, fmt='%g', \
xoffset=None, yoffset=None, ax=None, latmax=None, **text_kwargs)
# Draw and label meridians (longitude lines) for values (in degrees)
given in the sequence meridians.
drawparallels(circles, color='k', textcolor='k', linewidth=1.0, zorder=None,\
dashes=[1, 1], labels=[0, 0, 0, 0], labelstyle=None, fmt='%g', xoffset=None,\
yoffset=None, ax=None, latmax=None, **text_kwargs)
# Draw and label parallels (latitude lines) for values (in degrees) given in
the sequence circles.
'''
plt.show()