Analysis of spider data with python
**
preface
*** I have been studying spider of Python and data analysis lately. Make a summary of the method and idea with actual cases today.***
**
First chapter
1. How to get data with python spider
This article crawls the data of domestic e-commerce JD.com and foreign e-commerce Amazon. The tools used is Python. Here are the libraries that need to be import, requests, BeautifulSoup, pandas and selenium. Because the anti-crawling mechanism is different, the methods for crawling the two websites are introduced separately.
First introduced crawling Amazon
The methods used is requests plus bs4, first import the corresponding library
import requests
from bs4 import BeautifulSoup
import pandas as pd
from getip_xsdaili import GetIp
import time
import random
A self-built IP proxy pool is built here, and there are other better ways on the Internet
Now build a request header collection
user_agent_list = [      # create request user agent collection
    "Mozilla/5.0 (Windows NT 6.1; WOW64) AppleWebKit/537.1 "
    "(KHTML, like Gecko) Chrome/22.0.1207.1 Safari/537.1",
    "Mozilla/5.0 (X11; CrOS i686 2268.111.0) AppleWebKit/536.11 "
    "(KHTML, like Gecko) Chrome/20.0.1132.57 Safari/536.11",
    "Mozilla/5.0 (Windows NT 6.1; WOW64) AppleWebKit/536.6 "
    "(KHTML, like Gecko) Chrome/20.0.1092.0 Safari/536.6",
    "Mozilla/5.0 (Windows NT 6.2) AppleWebKit/536.6 "
    "(KHTML, like Gecko) Chrome/20.0.1090.0 Safari/536.6",
    "Mozilla/5.0 (Windows NT 6.2; WOW64) AppleWebKit/537.1 "
    "(KHTML, like Gecko) Chrome/19.77.34.5 Safari/537.1",
    "Mozilla/5.0 (X11; Linux x86_64) AppleWebKit/536.5 "
    "(KHTML, like Gecko) Chrome/19.0.1084.9 Safari/536.5",
    "Mozilla/5.0 (Windows NT 6.0) AppleWebKit/536.5 "
    "(KHTML, like Gecko) Chrome/19.0.1084.36 Safari/536.5",
    "Mozilla/5.0 (Windows NT 6.1; WOW64) AppleWebKit/536.3 "
    "(KHTML, like Gecko) Chrome/19.0.1063.0 Safari/536.3",
    "Mozilla/5.0 (Windows NT 5.1) AppleWebKit/536.3 "
    "(KHTML, like Gecko) Chrome/19.0.1063.0 Safari/536.3",
    "Mozilla/5.0 (Macintosh; Intel Mac OS X 10_8_0) AppleWebKit/536.3 "
    "(KHTML, like Gecko) Chrome/19.0.1063.0 Safari/536.3",
    "Mozilla/5.0 (Windows NT 6.2) AppleWebKit/536.3 "
    "(KHTML, like Gecko) Chrome/19.0.1062.0 Safari/536.3",
    "Mozilla/5.0 (Windows NT 6.1; WOW64) AppleWebKit/536.3 "
    "(KHTML, like Gecko) Chrome/19.0.1062.0 Safari/536.3",
    "Mozilla/5.0 (Windows NT 6.2) AppleWebKit/536.3 "
    "(KHTML, like Gecko) Chrome/19.0.1061.1 Safari/536.3",
    "Mozilla/5.0 (Windows NT 6.1; WOW64) AppleWebKit/536.3 "
    "(KHTML, like Gecko) Chrome/19.0.1061.1 Safari/536.3",
    "Mozilla/5.0 (Windows NT 6.1) AppleWebKit/536.3 "
    "(KHTML, like Gecko) Chrome/19.0.1061.1 Safari/536.3",
    "Mozilla/5.0 (Windows NT 6.2) AppleWebKit/536.3 "
    "(KHTML, like Gecko) Chrome/19.0.1061.0 Safari/536.3",
    "Mozilla/5.0 (X11; Linux x86_64) AppleWebKit/535.24 "
    "(KHTML, like Gecko) Chrome/19.0.1055.1 Safari/535.24",
    "Mozilla/5.0 (Windows NT 6.2; WOW64) AppleWebKit/535.24 "
    "(KHTML, like Gecko) Chrome/19.0.1055.1 Safari/535.24"
]
Next define the function to get the HTML of the web page
def getHTTMLText(url, proxies):
    try:
        headers = {                    # set request header information
            "User-Agent":
                random.choice(user_agent_list),
            "accept-encoding": "gzip, deflate, br",
            "accept-language": "zh-CN,zh;q=0.9,de;q=0.8",
            # "cookie": random.choice(cookie)
        }
        r = requests.get(url, headers=headers, timeout=30, proxies=proxies)
        r.raise_for_status()
        print(r.status_code)  #Show status code, if 200, then success
        r.encoding = r.apparent_encoding
        html = r.text
        return html
    except:
        print("error")
        return ""
Get the website’s HTML and parse it with bs4, encapsulating the methods into functions
def get_product_information(html):

    global product_informations
    soup = BeautifulSoup(html, "html.parser")
    # get information with BeautifulSoup
    try:
        list_title_total = soup.find("div", class_="s-result-list s-search-results sg-row")
        list_title_total1 = list_title_total.find_all("div", class_="a-section a-spacing-medium")
        for i in range(len(list_title_total1)):
            try:
                name = str(list_title_total1[i].find("span", class_="a-size-base-plus a-color-base a-text-normal").string).strip()
            except:
                name = ""
            try:
                stars = str(list_title_total1[i].find("span", class_="a-icon-alt").string).strip()
            except:
                stars = ""
            try:
                view = str(list_title_total1[i].find("div", class_="a-section a-spacing-none a-spacing-top-micro").find("span",
                                                                                                                        class_="a-size-base").string).strip()
            except:
                view = ""
            try:
                price = str(list_title_total1[i].find("span", class_="a-price").find("span", class_="a-offscreen").string).strip()
            except:
                price = ""

            a = [name, stars, view, price]
            product_informations.append(a)
    except:
        print("IP error")
Finally, the obtained data is formed into a table with pandas and saved to excel.
columns = ["name", "stars", "view", "price"]    # set columns of the table
if __name__ == '__main__':
    product_informations = []
    for j in range(0, 300, 10):
        demo = GetIp()       # call IP information
        ip_list = demo.get_ip_list(demo.url, demo.headers)
        if len(ip_list) == 10:
            for i in range(1, 11):
                proxies = {"http": "http://" + ip_list[i - 1]}
                html = getHTTMLText('https://www.amazon.com/s?k=hair&i=beauty&rh=n%3A3760911%2Cn%3A11057241%2Cn%3A17911764011%2Cn%3A11057651&dc&page={}&language=en_US&qid=1577671377&rnid=11055981&ref=sr_pg_{}'.format(j+i, j+i), proxies)
                get_product_information(html)
        df = pd.DataFrame(product_informations, columns=columns)
        print(df)
        # save data to excel
        df.to_excel("E:\爬虫数据\spider.net.xlsx", index=False, sheet_name='Sheet1')
This way, the data will be saved in Excel, however, the method of parsing the website page, such as the usage of bs4, and the usage of Xpath,we discuss in detail later.

Together with more than 11,000 rows of data, we got the product name, price, number of stars and reviews,analysis will be explained later.
Next introduced crawling JD.com
The methods used is selenium puls chromedriver, parsing is still using bs4, chromedriver needs to be downloaded by yourself without too much detail
First import the corresponding library
from bs4 import BeautifulSoup
import pandas as pd
from selenium import webdriver
Next, the obtained method and content are encapsulated in a function
def get_html_text(url):
    global product_informations
    # start up google chromedriver
    driver_path = 'D:\Downloads\chromedriver.exe'
    options = webdriver.ChromeOptions()
    options.add_argument('headless')  # set up headless mode
    driver = webdriver.Chrome(executable_path=driver_path, options=options)
    driver.implicitly_wait(10)
    driver.get(url)
    js = "var q=document.documentElement.scrollTop=10000"
    driver.execute_script(js)
    # get the html of the web page and parse it
    html = driver.page_source
    soup = BeautifulSoup(html, "html.parser")
    # get information with BeautifulSoup
    try:
        list_title_total = soup.find("ul", class_="gl-warp clearfix")
        list_title_total1 = list_title_total.find_all("li", class_="gl-item")
        for i in range(len(list_title_total1)):
            price = str(list_title_total1[i].find("div", class_="p-price").find("i").string).strip()

            name_all = list_title_total1[i].find("div", class_="p-name").find("a")
            name = [text.strip() for text in name_all.find_all(string=True) if text.parent.name != "span" and text.strip()][0]  # good

            shop = str(list_title_total1[i].find("div", class_="p-shop").find("a")["title"]).strip()

            comment = str(list_title_total1[i].find("div", class_="p-commit p-commit-n").find("a", class_="comment").string).strip()

            a = [name, price, shop, comment]
            product_informations.append(a)
    except:
        print("error")
        return ""
Construct a main function and complete the url information.
if __name__ == '__main__':
    product_informations = []
    for i in range(1, 101):
        # call function complete
        get_html_text('https://list.jd.com/list.html?cat=16750,16751,16756&page={}&sort=sort_totalsales15_desc&trans=1&JL=6_0_0#J_main'.format(i))
        df = pd.DataFrame(product_informations, columns=columns)
        # print(df)
        # save data to excel
        df.to_excel("E:\爬虫数据\spiderJD.xlsx", index=False, sheet_name='Sheet1')
Although the amount of code is simple in this way, Google’s simulated login service is used. This will take more time and consume more memory, which will require more computer memory. At the same time, the benefit is that it is not limited by IP and anti-crawling mechanisms.

Together with more than 10,000 rows of data, we got the product name, price, shop and reviews.
2. How to analyze the data
The main tools introduced in this article are Python’s data analysis package and visualization package and EXCEL
First analyze the data of JD
The methods used is pandas plus pyecharts, first import the data.
from pyecharts.charts import Bar, Grid
from pyecharts import options as opts
import pandas as pd
import re

data  = pd.read_excel("E:\spiderJD.xlsx")    # read data
data.tail(10)       # show the last ten informations

Consistent with Excel data, next process this data.
data.info()
data.dtypes         # view overall information and type of data

You can see the type of data and the number of non-empty rows.
data.isnull().any()           # see if there is missing data
data[data.isnull().values == True]   # view all missing data in the table
data.dropna(inplace=True)    # delete rows with missing data
data.info()
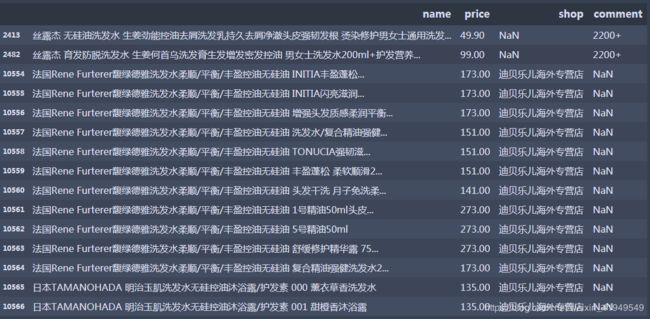

Look at null values and delete the entire row.Of course there are other better ways to fill these missing values.
data[(data["name"].duplicated() == True)]     # look at the name column for duplicate information
data.duplicated(subset=["name", "price"])             # see duplicate information in name and price columns
data[data.duplicated(subset=["name", "price"]) == True]
data.drop_duplicates(subset=["name", "price"], keep='first',inplace=True)    # delete duplicate data in both name and price columns, and retain the first occurrence
These are some ways to check for duplicate values.In the end we deleted the rows where both the name and the price are duplicates.
data[data["price"].str.isalpha() == True]         # check that the price column in the table is not numeric
data = data[data["price"].str.isalpha() == False]   #  exclude the price column in the table is not numeric
data["price"] = data["price"].apply(pd.to_numeric, errors='ignore') # force all data in the price column to numeric values
Check out the price column that is not a number and remove them.And force all remaining price data into numeric types.
Next we use regular expressions to process the data in the comment column.
# define a function that uses regular expressions to process comment data
def re_number(i):
    if "万" in i:
        res = int(re.sub("\D", "", i)) * 10000
    else:
        res = int(re.sub("\D", "", i))
    return res
# data['comment'] = data.apply(lambda x: re_number(x['comment']), axis = 1)
data['comment'] = data['comment'].apply(lambda x: re_number(x))     # the two motheds are equivalent
data.sort_values(by=["comment", "price"], ascending=[False, False])   # sort data by comment and price, and in descending order
In this way, we have a complete and clean data.
Now let ’s look at the descriptive statistics and correlation coefficients of the data.
data.describe()        # describe the data
data.corr('spearman')  # correlation coefficient

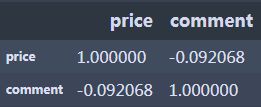
Equivalent reviews with sales for the time being, you can see a weak negative correlation between price and sales.
Next, we use the groupby method for group aggregation.
data_group = data.groupby(["shop"]).agg(['mean','count','max']).sort_values(by=("comment", "count"), ascending=[False])
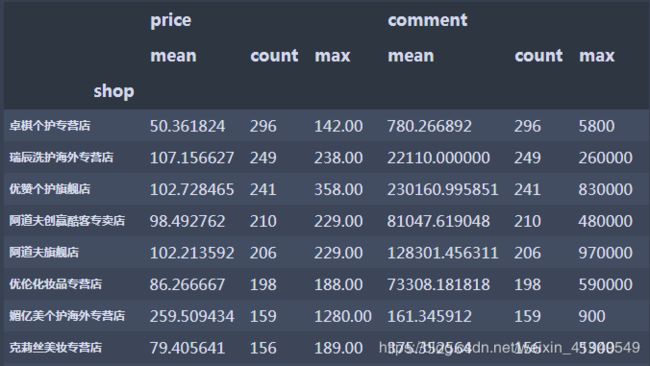
The data grouping calculation can be sorted freely by adjusting the parameters.
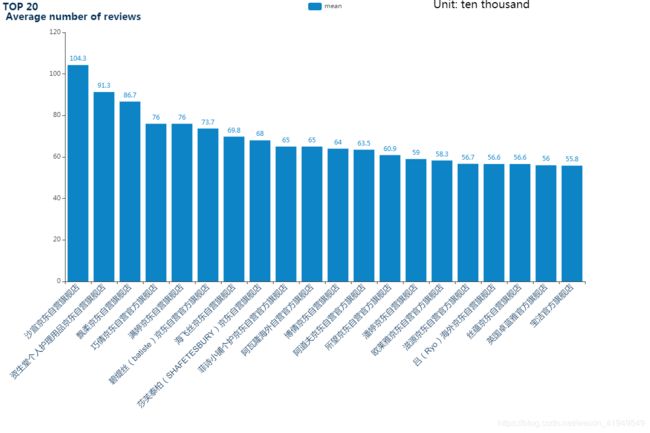
The following uses pyecharts to visualize the conclusion data.
name = list(data["name"][:20])
value = [x for x in list(data["comment"][:20])]
def grid_base() -> Grid:
    c = (
        Bar()
            .add_xaxis(name)
            .add_yaxis("count", value)
            .set_colors("#0c84c6")
            .set_global_opts(
            xaxis_opts=opts.AxisOpts(axislabel_opts=opts.LabelOpts(rotate=45, font_size=15, color="#002c53", font_family="Arial")),
            title_opts=opts.TitleOpts(title="TOP 20 \n hair loss \n average number of price", title_textstyle_opts=opts.TextStyleOpts(color="#002c53")),
            toolbox_opts=opts.ToolboxOpts(),
            graphic_opts=[opts.GraphicText(graphic_item=opts.GraphicItem(left=800, z=100),
                                           graphic_textstyle_opts=opts.GraphicTextStyleOpts(text="Unit: yuan", font="20px Microsoft YaHei"))]

        )
    )
    grid = Grid(dict(width="1200px", height="800px"))
    grid.add(c, grid_opts=opts.GridOpts(pos_bottom="35%"))
    return grid
By adjusting the parameters, you can also perform a variety of analysis on the data very flexibly.
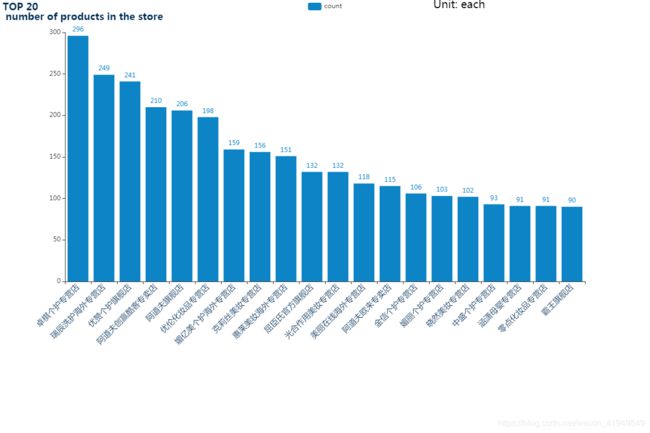
Individual analysis of data containing hair loss, use the merge method of pandas, similar to Vlookup in Excel.
infos = []
for i in data["name"]:
    if "脱发" in i:
        infos.append(i)
hair_loss = pd.DataFrame(infos, columns=["name"])
hair_loss = hair_loss.merge(data, on="name", how="inner")
hair_loss.sort_values(by=["comment", "price"], ascending=[False, False])
hair_loss = hair_loss.groupby(["shop"]).agg(['mean', 'count', 'max']).sort_values(by=("price", "mean"), ascending=[False])
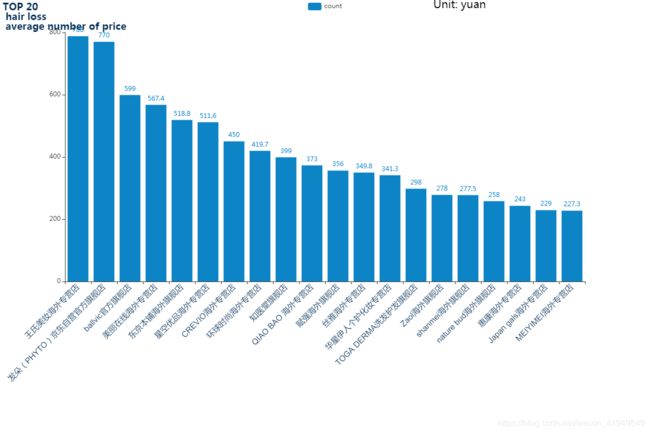

Finally check the correlation coefficient of hair loss data
hair_loss.corr('spearman')

Found to have a higher correlation coefficient than all data,explain that for hair loss products, the higher the price, the smaller the sales volume.
For other more valuable information, there is still deeper digging.
Since Amazon’s data cannot be obtained from the store, the data is relatively scattered, so this article will not do too much analysis.
**
Conclusion
**
This article mainly introduces how to use Python for data grabbing, and how to use pandas and pyecharts packages to clean and visualize data. It’s just a simple skin. An in-depth analysis of the problem must be combined with theory (logic) + professional financial analysis + statistics (data and quantitative analysis). Python is a practical tool for us to obtain and analyze data, and provides important aspects for verifying the correctness of analytical logic or theory.

