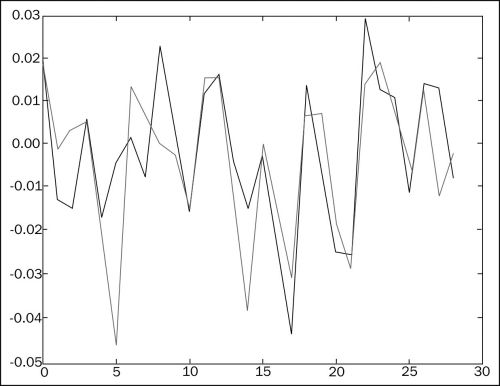
交易相关偶对
import numpy as np
from matplotlib.pyplot import plot
from matplotlib.pyplot import show
bhp = np.loadtxt('BHP.csv', delimiter=',', usecols=(6,), unpack=True)
bhp_returns = np.diff(bhp) / bhp[ : -1]
vale = np.loadtxt('VALE.csv', delimiter=',', usecols=(6,), unpack=True)
vale_returns = np.diff(vale) / vale[ : -1]
covariance = np.cov(bhp_returns, vale_returns)
print "Covariance", covariance
'''
Covariance [[ 0.00028179 0.00019766]
[ 0.00019766 0.00030123]]
'''
print "Covariance diagonal", covariance.diagonal()
print "Covariance trace", covariance.trace()
print covariance/ (bhp_returns.std() * vale_returns.std())
print "Correlation coefficient", np.corrcoef(bhp_returns, vale_returns)
'''
[[ 1.00173366 0.70264666]
[ 0.70264666 1.0708476 ]]
'''
difference = bhp - vale
avg = np.mean(difference)
dev = np.std(difference)
print "Out of sync", np.abs(difference[-1] - avg) > 2 * dev
t = np.arange(len(bhp_returns))
plot(t, bhp_returns, lw=1)
plot(t, vale_returns, lw=2)
show()

多项式拟合
import numpy as np
import sys
from matplotlib.pyplot import plot
from matplotlib.pyplot import show
bhp=np.loadtxt('BHP.csv', delimiter=',', usecols=(6,), unpack=True)
vale=np.loadtxt('VALE.csv', delimiter=',', usecols=(6,), unpack=True)
t = np.arange(len(bhp))
poly = np.polyfit(t, bhp - vale, int(sys.argv[1]))
print "Polynomial fit", poly
print "Next value", np.polyval(poly, t[-1] + 1)
print "Roots", np.roots(poly)
der = np.polyder(poly)
print "Derivative", der
print "Extremas", np.roots(der)
vals = np.polyval(poly, t)
print np.argmax(vals)
print np.argmin(vals)
plot(t, bhp - vale)
plot(t, vals)
show()
平衡成交量
import numpy as np
c, v=np.loadtxt('BHP.csv', delimiter=',', usecols=(6, 7), unpack=True)
change = np.diff(c)
print "Change", change
'''
Change [ 1.92 -1.08 -1.26 0.63 -1.54 -0.28 0.25 -0.6 2.15 0.69 -1.33 1.16
1.59 -0.26 -1.29 -0.13 -2.12 -3.91 1.28 -0.57 -2.07 -2.07 2.5 1.18
-0.88 1.31 1.24 -0.59]
'''
signs = np.sign(change)
print "Signs", signs
'''
Signs [ 1. -1. -1. 1. -1. -1. 1. -1. 1. 1. -1. 1. 1. -1. -1. -1. -1. -1.
-1. -1. -1. 1. 1. 1. -1. 1. 1. -1.]
'''
pieces = np.piecewise(change, [change < 0, change > 0], [-1, 1])
print "Pieces", pieces
print "Arrays equal?", np.array_equal(signs, pieces)
print "On balance volume", v[1:] * signs
'''
[ 2620800. -2461300. -3270900. 2650200. -4667300. -5359800. 7768400.
-4799100. 3448300. 4719800. -3898900. 3727700. 3379400. -2463900.
-3590900. -3805000. -3271700. -5507800. 2996800. -3434800. -5008300.
-7809799. 3947100. 3809700. 3098200. -3500200. 4285600. 3918800.
-3632200.]
'''
使用向量化来避免循环
import numpy as np
import sys
o, h, l, c = np.loadtxt('BHP.csv', delimiter=',', usecols=(3, 4, 5, 6), unpack=True)
def calc_profit(open, high, low, close):
buy = open * float(sys.argv[1])
if low < buy < high:
return (close - buy)/buy
else:
return 0
func = np.vectorize(calc_profit)
profits = func(o, h, l, c)
print "Profits", profits
real_trades = profits[profits != 0]
print "Number of trades", len(real_trades), round(100.0 * len(real_trades)/len(c), 2), "%"
print "Average profit/loss %", round(np.mean(real_trades) * 100, 2)
winning_trades = profits[profits > 0]
print "Number of winning trades", len(winning_trades), round(100.0 * len(winning_trades)/len(c), 2), "%"
Number of winning trades 16 53.33 %
print "Average profit %", round(np.mean(winning_trades) * 100, 2)
losing_trades = profits[profits < 0]
print "Number of losing trades", len(losing_trades), round(100.0 * len(losing_trades)/len(c), 2), "%"
print "Average loss %", round(np.mean(losing_trades) * 100, 2)
使用海宁函数实现平滑

import numpy as np
import sys
from matplotlib.pyplot import plot
from matplotlib.pyplot import show
N = int(sys.argv[1])
weights = np.hanning(N)
print "Weights", weights
'''
Weights [ 0. 0.1882551 0.61126047 0.95048443 0.95048443 0.61126047
0.1882551 0. ]
'''
bhp = np.loadtxt('BHP.csv', delimiter=',', usecols=(6,), unpack=True)
bhp_returns = np.diff(bhp) / bhp[ : -1]
smooth_bhp = np.convolve(weights/weights.sum(), bhp_returns)[N-1:-N+1]
vale = np.loadtxt('VALE.csv', delimiter=',', usecols=(6,), unpack=True)
vale_returns = np.diff(vale) / vale[ : -1]
smooth_vale = np.convolve(weights/weights.sum(), vale_returns)[N-1:-N+1]
K = int(sys.argv[1])
t = np.arange(N - 1, len(bhp_returns))
poly_bhp = np.polyfit(t, smooth_bhp, K)
poly_vale = np.polyfit(t, smooth_vale, K)
poly_sub = np.polysub(poly_bhp, poly_vale)
xpoints = np.roots(poly_sub)
print "Intersection points", xpoints
'''
Intersection points [ 27.73321597+0.j 27.51284094+0.j 24.32064343+0.j
18.86423973+0.j 12.43797190+1.73218179j 12.43797190-1.73218179j
6.34613053+0.62519463j 6.34613053-0.62519463j]
'''
reals = np.isreal(xpoints)
print "Real number?", reals
xpoints = np.select([reals], [xpoints])
xpoints = xpoints.real
print "Real intersection points", xpoints
print "Sans 0s", np.trim_zeros(xpoints)
plot(t, bhp_returns[N-1:], lw=1.0)
plot(t, smooth_bhp, lw=2.0)
plot(t, vale_returns[N-1:], lw=1.0)
plot(t, smooth_vale, lw=2.0)
show()


