数据处理:pandas中时间序列、数据可视化
目录
- 第一部分:pandas时间序列
- 一.python中的时间日期
- 二.pandas中的时间日期
- 三.时间重采样(resample)
- 四.文件中读取日期序列
- 第二部分:pandas数据可视化
- 一.线形图
- 二.柱状图(bar)
- 三.直方图(histogram)
- 四.密度图(kde)
- 五.散布图(scatter)
- 六.散饼图(pie)
第一部分:pandas时间序列
一.python中的时间日期
datetime模块和timedelta模块
1.datetime(2016, 3, 20, 8, 30).strftime('%Y-%m-%d %H:%M:%S')----strftime从time格式转化成字符串str格式,strftime()括号内为具体的字符串形式。
等价于datetime.strftime(datetime(2016, 3, 20, 8, 30),'%Y-%m-%d %H:%M:%S')
2.datetime.strptime('2016-03-20 09:30', '%Y-%m-%d %H:%M')----strptime从字符串str格式转化成time格式,括号内为待转换的字符串形式。
二.pandas中的时间日期
1.固定时刻timestamp:pandas会将datetime转换成timestamp形式。
日期序列:利用data_range()函数
1)pd.date_range('20160320', '20160331')----给出范围
2)pd.date_range(start='20160320', periods=10)----给出起始日期和周期
3)pd.date_range(start='20160320', periods=10, freq='4H')----给出起始、周期和时间频率
2.固定时期period:
1)p1 = pd.Period(2016, freq='M')----默认.Period()表示以年为周期
时期序列:利用period_range()函数
2)时期的频率转换:asfreq()
A-DEC: 以12月份作为结束的年时期
A-NOV: 以11月份作为结束的年时期
Q-DEC: 以12月份作为结束的季度时期
例1:将以年为单位、十二月为结尾的日期转换成以月为单位的时期
p = pd.Period('2016', freq='A-DEC')
p.asfreq('M', how='start'
out[]:Period('2016-01', 'M')
p.asfreq('M', how='end')
out[]:Period('2016-12', 'M')
例2:季度时期的表示:
p = pd.Period('2016Q4', 'Q-JAN')----表示季度时期,以一月份为结尾,2016Q4指的是2015年11月–2016年1月
例3:
# 获取该季度倒数第二个工作日下午4点的时间戳
p4pm = (p.asfreq('B', how='end') - 1).asfreq('T', 'start') + 16 * 60
3.timestamp和period转换:to_period()和to_timestamp
ts = pd.Series(np.random.randn(5), index = pd.date_range('2016-12-29', periods=5, freq='D'))
ts
out[]:
2016-12-29   -0.110462
2016-12-30   -0.265792
2016-12-31   -0.382456
2017-01-01   -0.036111
2017-01-02   -1.029658
Freq: D, dtype: float64

pts = ts.to_period(freq='M')
pts
out[]:
2016-12   -0.110462
2016-12   -0.265792
2016-12   -0.382456
2017-01   -0.036111
2017-01   -1.029658
Freq: M, dtype: float64

pts.groupby(level=0).sum()
out[]:
2016-12   -0.758711
2017-01   -1.065769
Freq: M, dtype: float64

pts.to_timestamp(how='end')
out[]:
2016-12-31   -0.110462
2016-12-31   -0.265792
2016-12-31   -0.382456
2017-01-31   -0.036111
2017-01-31   -1.029658
dtype: float64
三.时间重采样(resample)
1.高频率->低频率,降采样:默认每个周期取起始时间,即label=‘left’
1)例如分钟转化成五分钟:
ts = pd.Series(np.random.randint(0, 50, 60), index=pd.date_range('2016-04-25 09:30', periods=60, freq='T'))
# 0-4 分钟为第一组
ts.resample('5min', label='right').sum()
2)金融数据常用聚合函数.ohlc():Open/High/Low/Close
例:ts.resample('5min').ohlc()

3)可以用groupby()函数:
ts = pd.Series(np.random.randint(0,50,100),index=pd.date_range('2020-01-01',periods=100,freq='D'))
# 1.利用timestamp中的.month属性
ts.groupby(lambda x: x.month).sum()
# 2.把timestamp转换成period,并把周期设置成月份
ts.groupby(ts.index.to_period(freq='M')).sum()2.低频率->高频率,升采样:需要插值
例:df是以周为单位,周五作为结束的采样结果,使用.resample()变成以天为单位,并用.ffill()进行向前填充,最大填充数为3
df = pd.DataFrame(np.random.randint(1, 50, 2), index=pd.date_range('2016-04-22', periods=2, freq='W-FRI'))
df.resample('D').ffill(limit=3)
3.重采样:改变采样的周期或设置
df.resample('A-MAY')----指的是以年为单位,五月为结束,即2020-05是2020年,2020-06是2021年,默认十二月未结束。
四.文件中读取日期序列
存储在.csv文件中的日期序列在读取时默认是object类型,需要进行解析parse:
1)df = pd.read_csv('data/002001.csv', index_col='Date', parse_dates=True)----将read_csv()中的parse_dates设置为True,即可解析日期序列
2)自定义日期解析函数:将解析函数传递给.read_csv()中的date_praser
csv文件中的储存格式:

python中的读取:
def date_parser(s):
    s = '2016/' + s
    d = datetime.strptime(s, '%Y/%m/%d')
    return d
df = pd.read_csv('data/custom_date.csv', parse_dates=True, index_col='Date', date_parser=date_parser)
第二部分:pandas数据可视化
pandas的数据可视化使用matplotlib为基础组件,pandas里提供了一些比matplotlib更便捷的数据可视化操作,准备工作:
%matplotlib inline
import pandas as pd
import numpy as np
一.线形图
1)对于Series:
ts = pd.Series(np.random.randn(1000), index=pd.date_range('1/1/2000', periods=1000))
ts = ts.cumsum()
ts.plot(title='cumsum', style='r-', ylim=[-30, 30], figsize=(4, 3));----.plot()可以设置标题、线格式、y的范围和图形尺寸
2)对于DataFrame:
df = pd.DataFrame(np.random.randn(1000, 4), index=ts.index, columns=list('ABCD'))
df = df.cumsum()
df.plot(title='DataFrame cumsum', figsize=(4, 12), subplots=True, sharex=True, sharey=True);
默认subplots=False,所有数据都画在一张图上,x轴默认是行索引index,默认分图情况下x轴、y轴均共享。
也可以规定x轴和y轴显示的数据:
df['I'] = np.arange(len(df))
df.plot(x='I', y=['A', 'C'])
二.柱状图(bar)
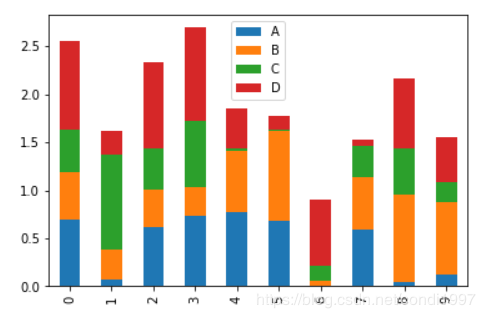
df = pd.DataFrame(np.random.rand(10, 4), columns=['A', 'B', 'C', 'D'])
1.两种等价方式:
1)df.iloc[1].plot(kind='bar')
2)df.iloc[1].plot.bar()
注:默认.bar(stacked=False),柱状图不堆叠,且为竖直verticle的柱状图,生成水平的horizental柱状图用.barh()
3)df.plot.bar(stacked=True)

4)df.plot.barh()

三.直方图(histogram)
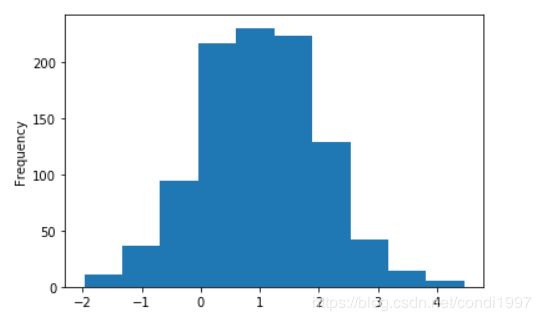
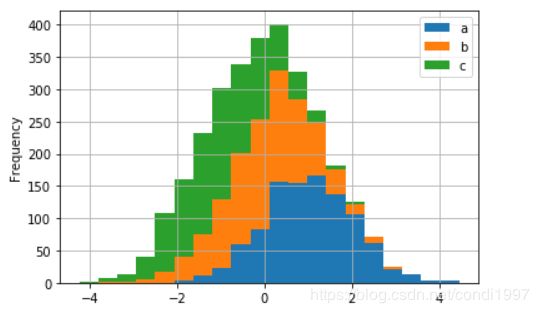
直方图是一种对值频率进行离散化的柱状图。
df = pd.DataFrame({'a': np.random.randn(1000) + 1, 'b': np.random.randn(1000),
'c': np.random.randn(1000) - 1}, columns=['a', 'b', 'c'])1)df['a'].plot.hist(bins=10)----其中bins为在取值范围内分的块数

2)df.plot.hist(stacked=True, bins=20, grid=True)----三列数据使用堆叠方式分成20份,grid指绘制网格

四.密度图(kde)
kde:核密度估计(kernel density estimation)
df.plot.kde()五.散布图(scatter)
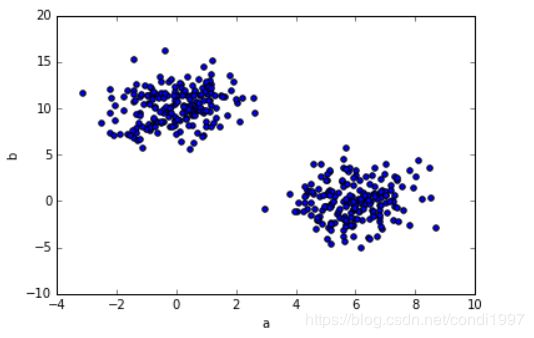
散布图是把所有的点画在同一个坐标轴上的图像,是观察两个一维数据之间关系的有效手段。
例:使用np.concatenate()将两个正态分布的数据拼接,即a是200个均值=0和200个均值=6的正态数据拼接,b和c同理,这样当a为x轴,b为y轴时散布图如下:
df = pd.DataFrame({'a': np.concatenate([np.random.normal(0, 1, 200), np.random.normal(6, 1, 200)]),
                  'b': np.concatenate([np.random.normal(10, 2, 200), np.random.normal(0, 2, 200)]),
                  'c': np.concatenate([np.random.normal(10, 4, 200), np.random.normal(0, 4, 200)])})
df.plot.scatter(x='a', y='b')
六.散饼图(pie)
s = pd.Series(3 * np.random.rand(4), index=['a', 'b', 'c', 'd'], name='series')
s.plot.pie(labels=['AA', 'BB', 'CC', 'DD'], colors=['r', 'g', 'b', 'c'],
           autopct='%.2f', fontsize=20, figsize=(6, 6))
其中labels设置标签,colors设置颜色,autopct设置百分比percent格式,fontsize设置字体大小,figsize设置窗口大小

