介绍
matplotlib 是python最著名的绘图库,它提供了一整套和matlab相似的命令API,十分适合交互式地进行制图。而且也可以方便地将它作为绘图控件,嵌入GUI应用程序中。
首先需要导入两个库numpy、matplotlib。
代码:
import numpy as np
import matplotlib.pyplot as plt
散点图1
height =  [161,170,182,175,173,165]
weight = [50,58,80,70,69,65]
plt.scatter(height,weight)
plt.show()
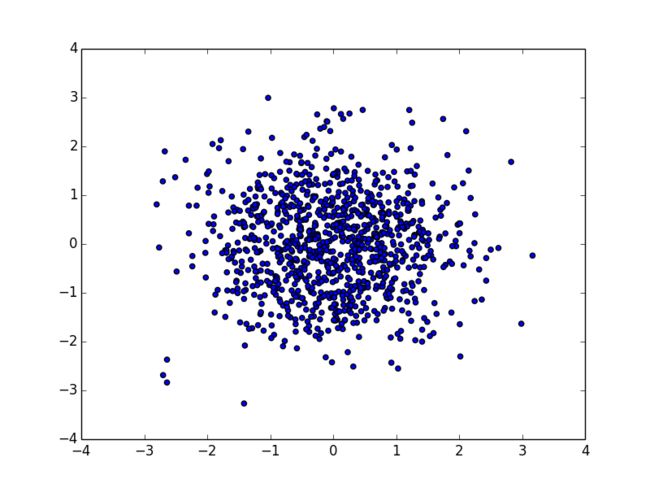
散点图2
x = np.random.randn(1000)
y = np.random.randn(1000)
plt.scatter(x,y)
plt.show()
np.random.randn(1000) 方法随机生成1000个随机数
scatter方法可添其他参数,得到散点图如下:
- s: 调整散点的面积大小
- c: 颜色
- marker:三点的形状
- alpha:透明度
plt.scatter(x,y,s=50,c='r',marker='<',alpha=0.5)
折线图1
x = np.linspace(-100,100,15)
y = x ** 2
plt.plot(x,y)
plt.show()
折线图2
x = np.linspace(-1000,1000,100)
y = np.random.randn(100)
plt.plot(x,y,color='r',marker='o')
plt.show()
条形图
n = 5
y = [20,40,60,50,30]
index = np.arange(n)
plt.bar(left=index,height=y,color='r',width=0.5)
plt.show()
条形图2
n = 5
y = [20,40,60,50,30]
index = np.arange(n)
plt.bar(left=0, bottom=index, height=0.5, color='r', width=y, orientation='horizontal')
plt.show()
条形图3
n = 5
y = [20,40,60,50,30]
index = np.arange(n)
plt.barh(left=0,bottom=index,width=y)
plt.show()
条形图4
index = np.arange(4)
sales_BJ = [52,55,63,53]
sales_SH = [44,80,67,34]
bar_width = 0.3
plt.bar(left=index,height=sales_BJ,width=bar_width,color="b")
plt.bar(left=index+bar_width,height=sales_SH,width=bar_width,color="r")
plt.show()
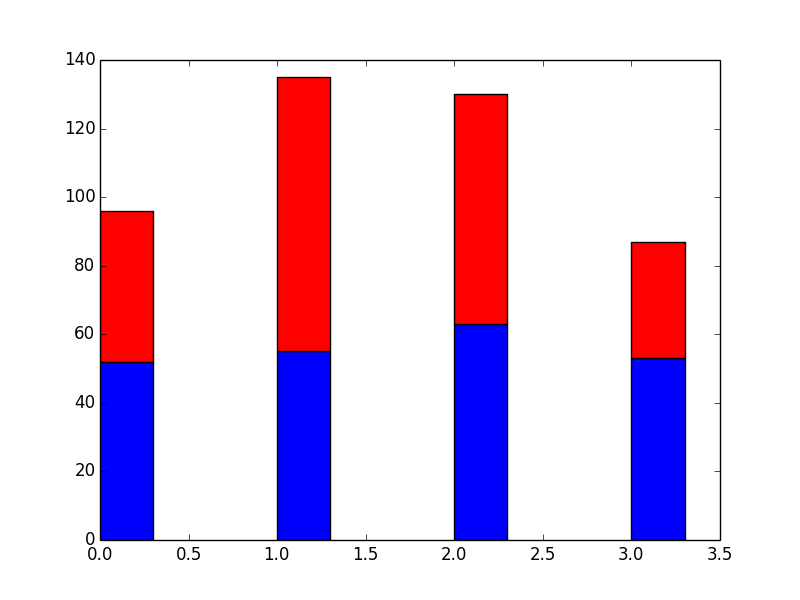
条形图5
index = np.arange(4)
sales_BJ = [52,55,63,53]
sales_SH = [44,80,67,34]
bar_width = 0.3
plt.bar(left=index,height=sales_BJ,width=bar_width,color="b")
plt.bar(left=index,height=sales_SH,width=bar_width,color="r",bottom=sales_BJ)
plt.show()
直方图
mu = 100
sigma = 20
x = mu + sigma * np.random.randn(20000)
plt.hist(x,100,color='g',normed=True)
plt.show()
2D直方图
x = np.random.randn(2000)+2
y = np.random.randn(2000)+3
plt.hist2d(x,y,bins=40)
plt.show()
饼状图
label = ['A','B','C','D']
fracs = [15,20,50,40]
plt.axes(aspect=1) #比例为一比一
expode = [0,0.05,0.06,0] #突出显示
plt.pie(x=fracs, labels=label,autopct='%.f%%',explode=expode,shadow=True)
plt.show()
箱形图1
np.random.seed(100)
data = np.random.normal(loc=0,size=1000,scale=1)
plt.boxplot(data,sym='o',whis=1.0)
plt.show()
箱形图2
np.random.seed(100)
data = np.rando
m.normal(size=(1000,4),loc=0,scale=1)
label = ['A','B','C','D']
plt.boxplot(x=data)
plt.show()


