10-支持相量积svm
tags: python,机器学习,svm
文章目录
- 支持相量积SVM概念
- 支持相量积做分类:SVC
- 测试数据准备
- 模型建立及设置模型参数
- 使用多种核函数对鸢尾花数据进行分类(SVC)
- 使用SVM多种核函数进行回归(SVR)
支持相量积SVM概念
SVM: Support Vector Machine。支持向量机,其含义是通过支持向量运算的分类器。其中“机”的意思是机器,可以理解为分类器。 那么什么是支持向量呢?在求解的过程中,会发现只根据部分数据就可以确定分类器,这些数据称为支持向量。 见下图,在一个二维环境中,其中点R,S,G点和其它靠近中间黑线的点可以看作为支持向量,它们可以决定分类器,也就是黑线的具体参数。
解决的问题:
-
线性分类
在训练数据中,每个数据都有n个的属性和一个二类类别标志,我们可以认为这些数据在一个n维空间里。我们的目标是找到一个n-1维的超平面(hyperplane),这个超平面可以将数据分成两部分,每部分数据都属于同一个类别。 其实这样的超平面有很多,我们要找到一个最佳的。因此,增加一个约束条件:这个超平面到每边最近数据点的距离是最大的。也成为最大间隔超平面(maximum-margin hyperplane)。这个分类器也成为最大间隔分类器(maximum-margin classifier)。 支持向量机是一个二类分类器。 -
非线性分类
SVM的一个优势是支持非线性分类。它结合使用拉格朗日乘子法和KKT条件,以及核函数可以产生非线性分类器。
注意:支持相量积,即可以做分类(SVC),又可以做回归(SVR)!
支持相量积做分类:SVC
测试数据准备
先生成需要分类的数据,这里我们生成两类数据,,并且具有两个中心:
from sklearn.datasets import make_blobs
data, target = make_blobs(centers=2, random_state=18)
plt.scatter(data[:,0], data[:,1], c=target)
模型建立及设置模型参数
建立训练模型:
from sklearn.svm import SVC
svc = SVC(kernel='linear', gamma='auto')
svc.fit(data, target)
其中SVC()中参数:
C:惩罚系数。控制模型拟合时的误差,C越大,则上下边界线内越不能出现数据点,即对拟合要求越高;C越小,则可以允许出现误差即上下边界内可以出现数据点。具体见下:
kernel:使用的算法模型,常用核函数
- 线性核函数kernel=‘linear’
采用线性核kernel='linear'的效果和使用sklearn.svm.LinearSVC实现的效果一样,但采用线性核时速度较慢,特别是对于大数据集,推荐使用线性核时使用LinearSVC - 多项式核函数kernel=‘poly’
使用该核函数时,可以额外设置以下参数
degree表示多项式的次数
gamma为多项式的系数,
coef0表示多项式的偏置 - 径向基核函数kernel=‘rbf’
选择该核函数时,可以设置gamma参数。
可以将gamma理解为支持向量影响区域半径的倒数,
gamma越大,支持向量影响区域越小,决策边界倾向于只包含支持向量,模型复杂度高,容易过拟合;
gamma越小,支持向量影响区域越大,决策边界倾向于光滑,模型复杂度低,容易欠拟合;
gamma的取值非常重要,即不能过小,也不能过大。 - sigmoid核函数kernel=‘sigmoid’
coef0控制r,sigmoid核函数是线性核函数经过tanh函数映射变化
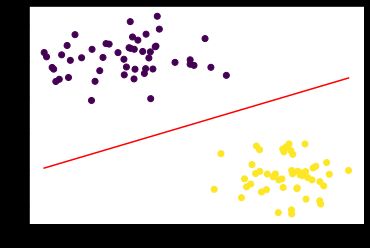
使用SVM将上面的点分开,可以看作是在三维中使用面将两组点分开,面方程为:z = w1*x1 + w2*x2 + b。
但是画图时需要显示2维的,所以三维映射到2维时,分开的面就变成了线,即另z=0,则上面的面方程变为了线方程x2 = -w1/w2 * x - b/ w2(此时我们画原数据散点图时,也要把x2对应的数据作为y轴数据)。
使用下面的代码获取系数:w1, w2 = svc.coef_[0,0], svc.coef_[0,1]
获取截距:b = svc.intercept_[0]
此时则可以获取到分开两堆数据的线方程了,将原数据和分开的线画出,如下:
x = np.linspace(data[:,0].min(),data[:,0].max(),100)
y = -w1/w2*x - b/w2
plt.scatter(data[:,0], data[:,1], c=target)
plt.plot(x,y,c='r')
另外我们也可以把支持相量对应的点画出来,并画出上边界、下边界间隔线:
获取支持相量:vectors = svc.support_vectors_
获取间隔线方程:
v_up1 = vectors[0]
b_up = v_up1[1] + w1/w2*v_up1[0]
y_ups = -w1/w2*x + b_up

v_down = vectors[1]
b_down = v_down[1] + w1/w2*v_down[0]
y_downs = -w1/w2*x + b_down
将结果展示出来:
plt.figure(figsize=(10,8))
plt.scatter(data[:,0], data[:,1], c=target)
plt.plot(x,y,c='r')
plt.plot(x,y_ups,ls=':')
plt.plot(x,y_downs,ls=':')
plt.scatter(vectors[:,0],vectors[:,1],c=[2,1],marker="o",s=400)
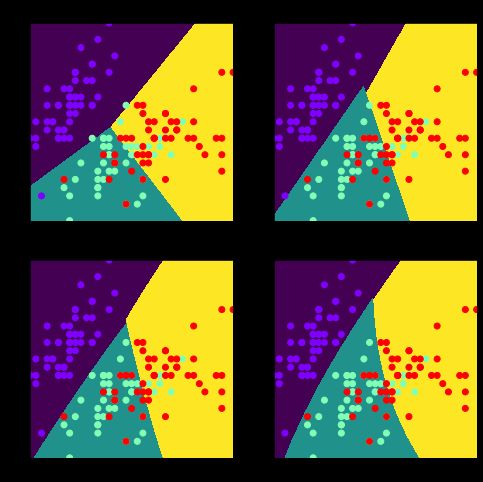
使用多种核函数对鸢尾花数据进行分类(SVC)
from sklearn.datasets import load_iris
from sklearn.svm import LinearSVC, SVC
iris = load_iris()
data = iris['data'][:,0:2]
target = iris['target']

estimators = {
    'Linear_svc':LinearSVC(max_iter=10000),
    'linear_svc':SVC(kernel='linear'),
    'rbf_svc':SVC(kernel='rbf'),
    'poly_svc':SVC(kernel='poly')
}
x, y = np.linspace(data[:,0].min(), data[:,0].max(),1000),  np.linspace(data[:,1].min(), data[:,1].max(),1000)
X, Y = np.meshgrid(x,y)
XY = np.c_[X.reshape(-1), Y.reshape(-1)]

y_preds = {}
for name, estimator in estimators.items():
    estimator.fit(data,target)
    y_ = estimator.predict(XY)
    y_preds[name] = y_

plt.figure(figsize=(2*4,2*4))
for i, name in enumerate(y_preds):
    plt.subplot(2,2,i+1)
    plt.pcolormesh(X,Y,y_preds[name].reshape(1000,1000))
    plt.title(name)
    plt.scatter(data[:,0],data[:,1],c=target,cmap='rainbow')
使用SVM多种核函数进行回归(SVR)
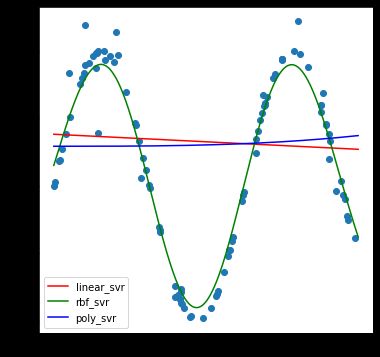
如果需要使用支持相量积SVM进行回归训练时,则需要使用SVM中的另一个模型SVR。
from sklearn.svm import SVR
np.random.seed(1)
x = np.random.rand(100)*10
y = np.sin(x)
y[::4] += np.random.randn(25)*0.3

estimators = {
    'linear_svr': SVR(kernel='linear'),
    'rbf_svr': SVR(kernel='rbf'),
    'poly_svr': SVR(kernel='poly')
}
X_test = np.linspace(0,10,1000).reshape(-1,1)
y_preds = {}
for name, estimator in estimators.items():
    estimator.fit(x.reshape(-1,1), y)
    print(name,estimator.score(x.reshape(-1,1), y))

    y_ = estimator.predict(X_test)
    y_preds[name] = y_

plt.figure(figsize=(6,6))
plt.scatter(x,y)
c = ['r','g','b']
i = 0
for name, val in y_preds.items():
    plt.plot(X_test,val,label=name,c=c[i])
    i += 1
plt.legend()


