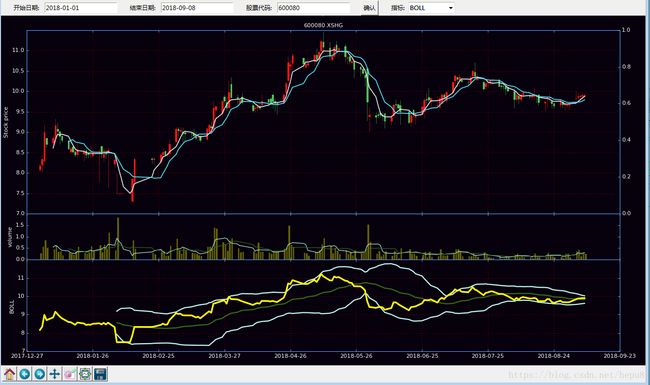
自己做量化交易软件(5)通通量化中创作的布林指标BOLL线
自己做量化交易软件(5)通通量化中创作的布林指标BOLL线
我们读者下载了通通量化演示框架的源代码。在这个代码中没有发现BOLL指标线的算法和绘图函数,我在这篇文章中,假设用户自己创作了新指标BOLL,如果增加到通通量化软件中。
另外本次上传代码都是演示框架代码,我们后面升级改进后,还会上传更新的源代码。
BOLL指标是根据统计学中的标准差原理设计出来的一种非常简单实用的技术分析指标,BOLL指标又叫布林线指标,是研判市场运动趋势的一种中长期技术分析工具。
BOLL是利用“价格通道”来显示市场价格的各种价位,当市场波动很小,处于盘整时,价格通道就会变窄,这可能预示着市场的波动处于暂时的平静期;当市场价格波动超出狭窄的价格通道的上轨时,预示着市场的异常激烈的向上波动即将开始;当市场价格波动超出狭窄的价格通道的下轨时,同样也预示着市场的异常激烈的向下波动将开始。
BOLL指标一共由三条线组成,即上轨线UPPER 、中轨线MID、下轨线DOWN。计算公式如下,N为可变参数。
N:=26;
MID : MA(CLOSE,N);
UPPER: MID + 2*STD(CLOSE,N);
DOWN: MID - 2*STD(CLOSE,N);
一、创建通用STD函数。
首先遇到的问题,在python2和python3中,std()函数的方法不同,为了能够在python2和python3上都能使用。
你可以参考HP_lib.py中的G_MA(df,n)的定义,修改为G_STD(df,n)。
G_MA()的源代码如下。
#通用MA计算
def G_MA(Series,n):
    G_pyver=int(platform.python_version()[0:1])
    G_ma=None
    if G_pyver==2:
        G_MAstr='pd.rolling_mean(Series,n)'
        G_ma=eval(G_MAstr)
    else :
        G_MAstr='Series.rolling(window=n,center=False).mean()'
        G_ma=eval(G_MAstr)
    return G_ma
我们仿照出G_STD()函数如下,写到HP_lib.py文件中。
#通用STD计算
def G_STD(Series,n):
    G_pyver=int(platform.python_version()[0:1])
    G_ma=None
    if G_pyver==2:
        G_MAstr='pd.rolling_std(Series,n)'
        G_ma=eval(G_MAstr)
    else :
        G_MAstr='Series.rolling(window=n,center=False).std()'
        G_ma=eval(G_MAstr)
    return G_ma
二、创建布林函数BOLLX(df, n)
在文件HP_lib.py中,G_STD(Series,n)定义后面,建立自定义BOLLX()函数,根据上面BOLL指标原理写出的代码如下:
#自定义BOLL指标
def BOLLX(df, n):
    MA = G_MA(df['close'], n)
    MSD=G_STD(df['close'], n)
    B1 = pd.Series(MA, name = 'BOLL_m')
    df = df.join(B1)
    u=MA+2*MSD
    d=MA-2*MSD
    B1 = pd.Series(u, name = 'BOLL_u')
    df = df.join(B1)
    B2 = pd.Series(d, name = 'BOLL_d' )
    df = df.join(B2)
    return df
三、创建BOLL指标绘图函数
在文件HP_draw.py中增加布林指标绘图函数draw_BOLL(ax1,days,x),源代码如下。
def draw_BOLL(ax1,days,x):
        rsiCol = '#c1f9f7'
        posCol = '#386d13'
        negCol = '#8f2020'
        df=mylib.BOLLX(days,x)
        ax2 = plt.subplot2grid((7,4), (5,0), sharex=ax1, rowspan=2, colspan=4, axisbg='#07000d')
        fillcolor = '#00ffe8'
        ax2.plot(df.date.values, df.BOLL_u.values, color=rsiCol, lw=2)
        ax2.plot(df.date.values, df.BOLL_m.values, color=posCol, lw=2)
        ax2.plot(df.date.values, df.BOLL_d.values, color=rsiCol, lw=2)
        ax2.plot(df.date.values, df.close.values, color='yellow', lw=3)
        plt.gca().yaxis.set_major_locator(mticker.MaxNLocator(prune='upper'))
        ax2.spines['bottom'].set_color("#5998ff")
        ax2.spines['top'].set_color("#5998ff")
        ax2.spines['left'].set_color("#5998ff")
        ax2.spines['right'].set_color("#5998ff")
        ax2.tick_params(axis='x', colors='w')
        ax2.tick_params(axis='y', colors='w')
        ax2.grid(True, color='r')
        plt.ylabel('BOLL', color='w')
        ax2.yaxis.set_major_locator(mticker.MaxNLocator(nbins=6, prune='upper'))
        return
四、在主窗口中增加布林线命令
打开文件HP_view.py
找到代码: bookChosen[‘values’] = (‘MACD’, ‘KDJ’,’RSI’,’OBV’)
修改为:bookChosen[‘values’] = (‘MACD’, ‘KDJ’,’RSI’,’OBV’,’BOLL’)
找到2处如下代码:
        if G_index=='KDJ' :
            mydraw.draw_KDJ(ax1,days,9,3,3)
        if G_index=='MACD' :
            mydraw.draw_MACD(ax1,days,12,26,9)
        if G_index=='RSI' :
            mydraw.draw_RSI(ax1,days,6,12,24)
        if G_index=='OBV' :
            mydraw.draw_OBV(ax1,days,6,12)
修改为:
        if G_index=='KDJ' :
            mydraw.draw_KDJ(ax1,days,9,3,3)
        if G_index=='MACD' :
            mydraw.draw_MACD(ax1,days,12,26,9)
        if G_index=='RSI' :
            mydraw.draw_RSI(ax1,days,6,12,24)
        if G_index=='OBV' :
            mydraw.draw_OBV(ax1,days,6,12)
        if G_index=='BOLL' :
            mydraw.draw_BOLL(ax1,days,26)
运行主程序,选择BOLL指标线,运行结果图形如下。
通通股票量化分析框架采用模块化设计,每个模块存放在不同的py文件中。
通通股票量化分析框架下载:
https://download.csdn.net/download/hepu8/10668509
运行python环境,可以在我的网盘下载绿色python软件,不用安装设置,解包就能运行,已经安装了常用软件包。用户根据自己需要选择所需版本,hpython36是python3.6版本,hpython27是python2.7。
hpyton27下载网盘: https://pan.baidu.com/s/14TAGHiJzommKKIA9n2iGiw
hpyton36下载网盘: https://pan.baidu.com/s/112_IwCJg49c2P4TU3PFomw
用户不需要我们提供的绿色版本,也可参考下面我写的文章,重新构建自己的python环境。
自己做量化交易软件(1) 免费量化分析环境安装使用
https://blog.csdn.net/hepu8/article/details/81866694
