通过生成人工数据集合,基于TensorFlow实现y=3*x+2线性回归
import numpy as np
import matplotlib.pyplot as plt
import tensorflow.compat.v1 as tf

# tf.enable_eager_execution()  # 在TensorFlow1.X版本中启用Eager Execution模式
tf.disable_eager_execution()  # 在TensorFlow2.X版本关闭Eager Execution
tf.__version__
1、生成x_data,值为[0, 100]之间500个等差数列数据集合作为样本特征,根据目标线性方程y=3*x+2,生成相应的标签集合y_data
x_data = np.linspace(0, 100, 500)
y_data = 3* x_data + 2 + np.random.randn(500) * 0.5
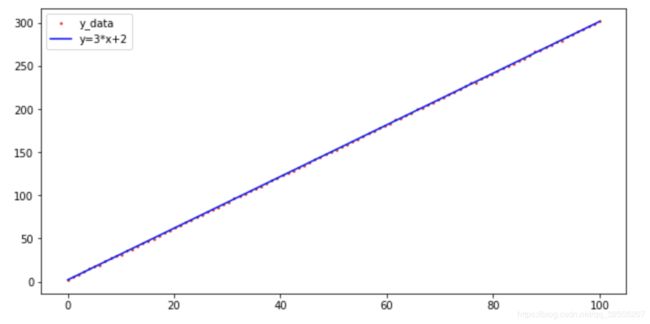
2、画出随机生成数据的散点图和想要通过学习得到的目标线性函数y=3*x+2
x_data = np.linspace(0, 100, 500)
y_data = 3 * x_data + 2 + np.random.randn(500) * 0.5

plt.figure(figsize=[10, 5])
plt.plot(x_data, y_data, 'r.', markersize=3)
plt.plot(x_data, 3 * x_data + 2, 'b-')
plt.legend(['y_data', 'y=3*x+2'])
x = tf.placeholder('float', name='x')
y = tf.placeholder('float', name='y')
w = tf.Variable(1.0, name='w0')
b = tf.Variable(1.0, name='b0')
def model(x, w, b):
    return x * w + b
pred = model(x, w, b)
4、训练模型,10轮,每训练50个样本显示损失值
train_epochs = 10
learning_rate = 0.0001
display_step = 50
loss_function = tf.reduce_mean(tf.square(y - pred))
optimizer = tf.train.GradientDescentOptimizer(learning_rate).minimize(loss_function)
sess = tf.Session()
init = tf.global_variables_initializer()
loss_list = []
step = 0
sess.run(init)
for epoch in range(train_epochs):
    for xs, ys in zip(x_data, y_data):
        _, loss = sess.run([optimizer, loss_function], feed_dict={x: xs, y: ys})
        loss_list.append(loss)
        step += 1
        if step % display_step == 0:
            print(f'Train Epoch: {epoch+1:02d}, Step: {step:03d}, loss={loss:.9f}')
5、通过训练出的模型预测x=5.79 时y的值,并显示根据目标方程显示的 y 值
x_test = 5.79
y_hat = sess.run(model(x_test, w, b))
y_target = 3 * x_test + 2
print(f'当x=5.79时,目标值为{y_target},模型预测值为{y_hat}')
6、通过Tensorboard显示构建的计算图
logdir = './'
tf.summary.FileWriter(logdir, tf.get_default_graph()).close()

