R语言可视化(六)
可视化图例位置的调整
可视化百度云资料链接为:
链接:https://pan.baidu.com/s/1w-mjJfZZFAK0R0ELdT9Ihg
提取码:zx9e
数据读取
library(ggplot2)
library(RColorBrewer)
library(reshape2)
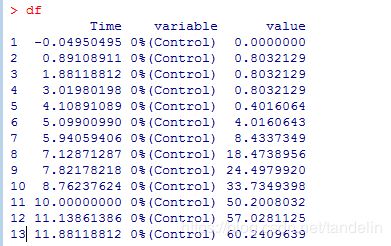
df<-read.csv("Data.csv", header = TRUE)
数据描述
数据及代码的参考资料为:
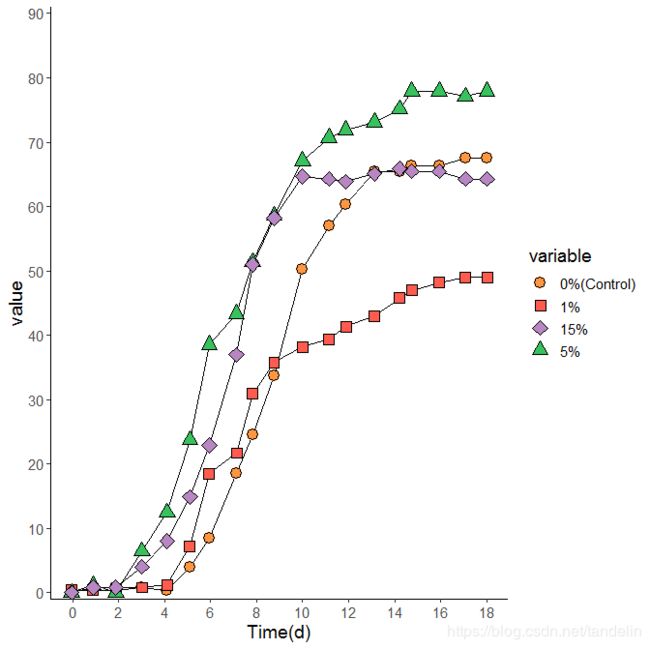
绘图
ggplot(data=df, aes(x=Time,y=value,fill=variable,shape=variable)) +
  geom_line()+
  geom_point(size=4,colour="black") +
  scale_fill_manual(values=c("#FF9641","#FF5B4E","#B887C3","#38C25D"))+
  scale_shape_manual(values=c(21,22,23,24))+

  scale_x_continuous(name="Time(d)",breaks=seq(0,20,2))+
  scale_y_continuous(breaks=seq(0,90,10),limits=c(0,90),expand =c(0, 1))+

  theme_classic()+
  theme(
    text=element_text(size=14,color="black"),
    legend.background = element_rect(fill="white"),
    legend.position="right"
  )
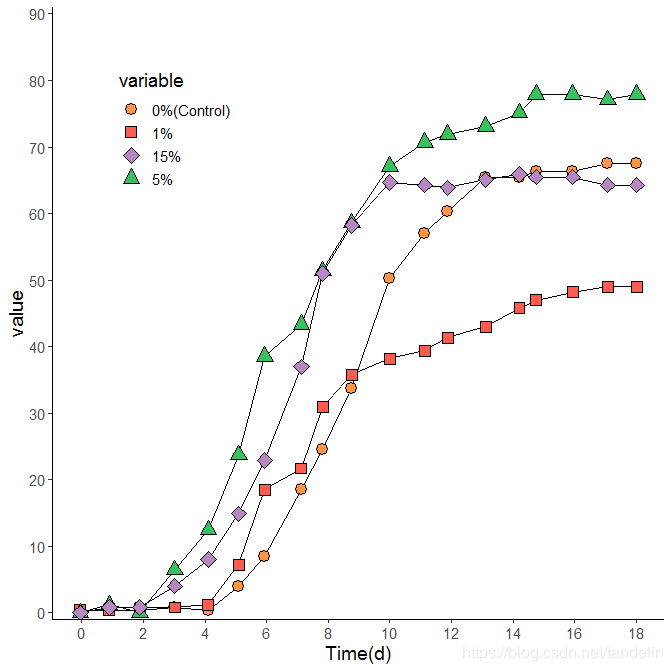
改变图例位置
ggplot(data=df, aes(x=Time,y=value,fill=variable,shape=variable)) +
  geom_line()+
  geom_point(size=4,colour="black") +
  scale_fill_manual(values=c("#FF9641","#FF5B4E","#B887C3","#38C25D"))+
  scale_shape_manual(values=c(21,22,23,24))+

  scale_x_continuous(name="Time(d)",breaks=seq(0,20,2))+
  scale_y_continuous(breaks=seq(0,90,10),limits=c(0,90),expand =c(0, 1))+

  theme_classic()+
  theme(
    text=element_text(size=14,color="black"),
   legend.background = element_blank(),
    legend.position=c(0.2,0.8)
  )
参考资料1:https://github.com/EasyChart/Beautiful-Visualization-with-R/
参考资料2:https://blog.csdn.net/tandelin/article/details/87719623