opencv--python实现:图像的几何变换(平移、旋转、仿射变换等)
图像的几何变换
转自:https://blog.csdn.net/g11d111/article/details/79978582
一、缩放变换
- 缩放就是改变图像的大小,使用**cv2.resize()**函数。
- 图像的大小可以手动指定,也可以使用缩放比例。
- cv2.resize()支持多种插值算法,默认使用的是cv2.INTER_LINEAR(不管放大和缩小)。
- 缩小最适合使用:cv2.INTER_AREA,放大最适合使用:cv2.INTER_CUBIC (慢) 或cv2.INTER_LINEAR。
import cv2
import numpy as np

img = cv2.imread('F:/xmyz.png')

res1 = cv2.resize(img, None, fx=2, fy=2, interpolation=cv2.INTER_CUBIC)
cv2.imshow("res1", res1)

# 或者

height, width = img.shape[:2]
res2 = cv2.resize(img, (2 * width, 2 * height), interpolation=cv2.INTER_CUBIC)
cv2.imshow('res2', res2)

cv2.waitKey(0)
二、平移变换
如下代码平移(100,50):
import cv2
import numpy as np

img = cv2.imread('F:/xmyz.png', 1)
rows, cols, channel = img.shape

M = np.float32([[1, 0, 100], [0, 1, 50]])
dst = cv2.warpAffine(img, M, (cols, rows))

cv2.imshow('img', dst)
cv2.waitKey(0)
cv2.destroyAllWindows()
cv2.warpAffine()的第三个参数是输出图像的大小。
三、旋转变换
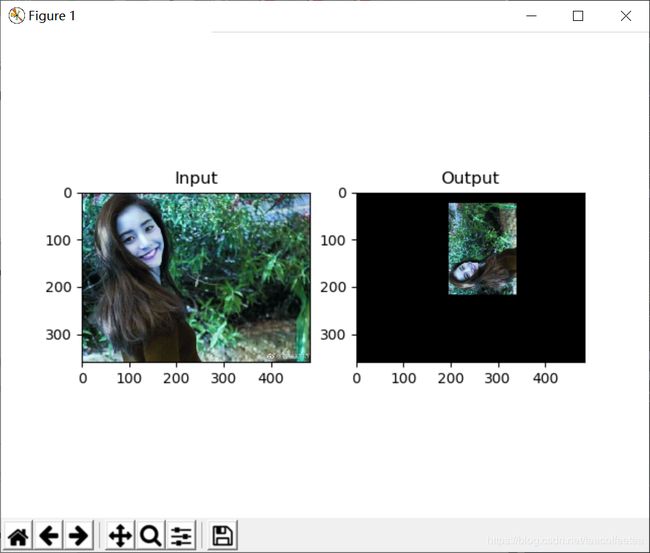
在opencv中提供了cv2.getRotationMatrix2D函数获得变换矩阵。第一参数指定旋转圆点;第二个参数指定旋转角度;第二个参数指定缩放比例。看如下例子:
import cv2
import numpy as np

img = cv2.imread('F:/xmyz.png', 1)
rows, cols, channel = img.shape

M = cv2.getRotationMatrix2D((cols / 2, rows / 3), 90, 0.4)
dst = cv2.warpAffine(img, M, (cols, rows))

cv2.imshow('img', dst)
cv2.waitKey(0)
cv2.destroyAllWindows()
四、仿射变换
仿射变换是一种二维坐标到二维坐标之间的线性变换,并保持二维图形的“平直性”。转换前平行的线,在转换后依然平行。
import cv2
import numpy as np
from matplotlib import pyplot as plt

img = cv2.imread('F:/xmyz.png', 1)
rows, cols, channel = img.shape

pts1 = np.float32([[50, 50], [200, 50], [50, 200]])
pts2 = np.float32([[10, 100], [200, 50], [100, 250]])

M = cv2.getRotationMatrix2D((cols / 2, rows / 3), 90, 0.4)
dst = cv2.warpAffine(img, M, (cols, rows))

plt.subplot(121), plt.imshow(img), plt.title('Input')
plt.subplot(122), plt.imshow(dst), plt.title('Output')
plt.show()
五、透视变换
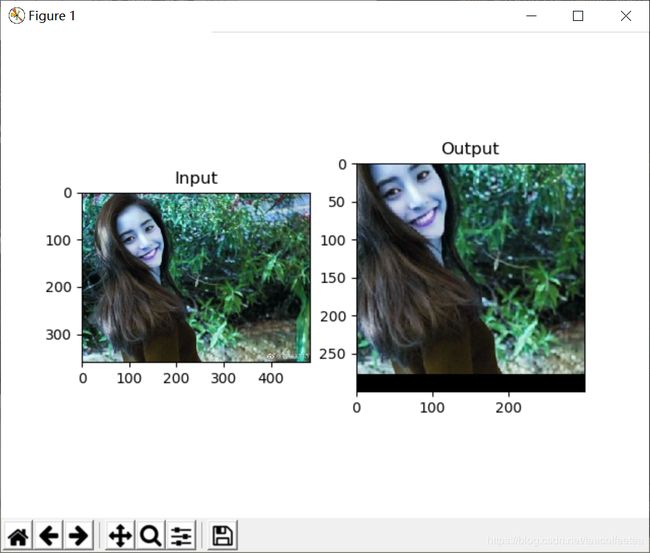
透视变换需要3×3的变换矩阵,直线在变换后还是保持直线。为了构造变换矩阵,你需要输入图像的4个点和对应的要输出图像的4个点;要求这4个点其中3个点不共线。使用cv2.getPerspectiveTransform函数构造透视变换矩阵。代码:
import cv2
import numpy as np
from matplotlib import pyplot as plt

img = cv2.imread('F:/xmyz.png', 1)
rows, cols, channel = img.shape

pts1 = np.float32([[56, 65], [368, 52], [28, 387], [389, 390]])
pts2 = np.float32([[0, 0], [300, 0], [0, 300], [300, 300]])

M = cv2.getPerspectiveTransform(pts1, pts2)
dst = cv2.warpPerspective(img, M, (300, 300))

plt.subplot(121), plt.imshow(img), plt.title('Input')
plt.subplot(122), plt.imshow(dst), plt.title('Output')
plt.show()


