kNN分类算法python实现
安装python
Matplotlib依赖于Python和NumPy,所以在unbuntu上安装python的快捷方法就是直接安装Matplotlib
>sudo apt-get install python-matplotlibkNN算法伪代码
1.计算已知类别数据集中的点与当前点之间的距离;
2.按照距离递增次序排序;
3.选取与当前距离最小的k个点;
4.确定前k个点所在类别的出现频率;
5.返回前k个点中出现频率最高的类别作为当前点的预测分类;
优点:简单有效
缺点:空间时间复杂度高,无法知晓平均实例样本和典型实例样本的特征
实例一 二维点分类
给出4个二维数据点及其对应分类,用k-mean算法,对新输入的点进行分类
此处距离使用欧几里得距离
from numpy import *
import operator

def createDataSet():
    group = array([[1.0,1.1],[1.0,1.0],[0,0],[0,0.1]])
    labels = ['A','A','B','B']
    return group, labels


def classify0(inX, dataSet, labels, k):
    dataSetSize = dataSet.shape[0]
    #calculate the distance
    diffMat = tile(inX, (dataSetSize,1)) - dataSet
    sqDiffMat = diffMat**2
    sqDistances = sqDiffMat.sum(axis=1)
    distances = sqDistances**0.5
    sortedDistIndicies = distances.argsort()
    classCount={}
    #select k nearby points
    for i in range(k):
        voteIlabel = labels[sortedDistIndicies[i]]
        classCount[voteIlabel] = classCount.get(voteIlabel,0) + 1
    #sort
    sortedClassCount = sorted(classCount.iteritems(),
        key=operator.itemgetter(1),reverse=True)
    return sortedClassCount[0][0]
运行程序
>>> import kNN
>>> group,labels = kNN.createDataSet()
>>> group
array([[ 1. ,  1.1],
       [ 1. ,  1. ],
       [ 0. ,  0. ],
       [ 0. ,  0.1]])
>>> labels
['A', 'A', 'B', 'B']
实例二 约会网站数据分类
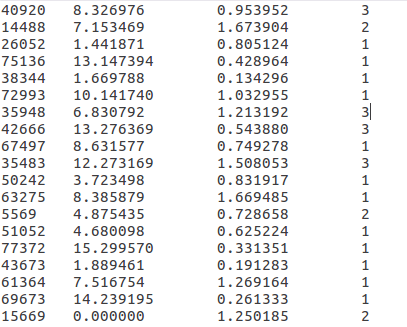
从文本文件中解析数据
数据说明
| 第一列 | 第二列 | 第三列 | 第四列 |
|---|---|---|---|
| 飞行里程 | 玩游戏时间百分比 | 消费冰淇淋公升数 | 喜好程度 |
数据内容
#transfer text to matrix
def file2matrix(filename):
    fr = open(filename)
    numberOfLines = len(fr.readlines())         #get the number of lines in the file
    returnMat = zeros((numberOfLines,3))        #prepare matrix to return
    classLabelVector = []                       #prepare labels return
    fr = open(filename)
    index = 0
    for line in fr.readlines():
        line = line.strip()
        listFromLine = line.split('\t')
        returnMat[index,:] = listFromLine[0:3]
        classLabelVector.append(int(listFromLine[-1]))
        index += 1
    return returnMat,classLabelVector
程序运行
>>> reload(kNN)
<module 'kNN' from 'kNN.pyc'>
>>> datingDataMat, datingLabels = kNN.file2matrix('datingTestSet2.txt')
>>> datingDataMat
array([[  4.09200000e+04,   8.32697600e+00,   9.53952000e-01],
       [  1.44880000e+04,   7.15346900e+00,   1.67390400e+00],
       [  2.60520000e+04,   1.44187100e+00,   8.05124000e-01],
       ...,
       [  2.65750000e+04,   1.06501020e+01,   8.66627000e-01],
       [  4.81110000e+04,   9.13452800e+00,   7.28045000e-01],
       [  4.37570000e+04,   7.88260100e+00,   1.33244600e+00]])
>>> datingLabels
[3, 2, 1, 1, 1, 1, 3, 3, 1, 3, 1, 1, 2, 1, 1, 1, 1, 1, 2, 3, 2, 1, 2, 3, 2, 3, 2, 3, 2, 1, 3, 1, 3, 1, 2, 1, 1, 2, 3, 3, 1, 2, 3, 3, 3, 1, 1, 1, 1, 2, 2, 1, 3, 2, 2, 2, 2, 3, 1, ....
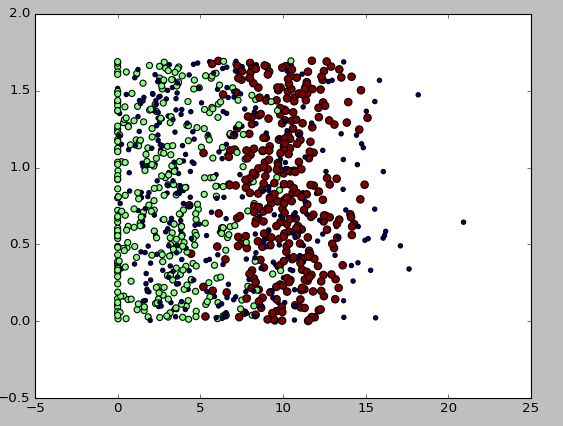
使用Matplotlib创建散点图
直观的查看数据分布
>>> from numpy import array
>>> import matplotlib
>>> import matplotlib.pyplot as plt
>>> fig = plt.figure()
>>> ax = fig.add_subplot(111)
>>> ax.scatter(datingDataMat[:,1],datingDataMat[:,2],15.0*array(datingLabels),15.0*array(datingLabels))
0x7ff4d5299690>
>>> plt.show()

横坐标:玩游戏所耗时间百分比
纵坐标:每周消耗的冰淇淋公升数
散点:对应三个分类,scatter函数调用中,用不同颜色标注出来了
数据归一化
公式,类似matlab中的minmax
newValue = (oldValue-min)/(max-min)kNN.py中的python实现代码
#minmax
def autoNorm(dataSet):
    minVals = dataSet.min(0)
    maxVals = dataSet.max(0)
    ranges = maxVals - minVals
    normDataSet = zeros(shape(dataSet))
    m = dataSet.shape[0]
    normDataSet = dataSet - tile(minVals, (m,1))
    normDataSet = normDataSet/tile(ranges, (m,1))   #element wise divide
    return normDataSet, ranges, minVals
运行
>>> reload(kNN)
<module 'kNN' from 'kNN.py'>
>>> normMat, ranges,minVals = kNN.autoNorm(datingDataMat)
>>> normMat
array([[ 0.44832535,  0.39805139,  0.56233353],
       [ 0.15873259,  0.34195467,  0.98724416],
       [ 0.28542943,  0.06892523,  0.47449629],
       ...,
       [ 0.29115949,  0.50910294,  0.51079493],
       [ 0.52711097,  0.43665451,  0.4290048 ],
       [ 0.47940793,  0.3768091 ,  0.78571804]])
>>> ranges
array([  9.12730000e+04,   2.09193490e+01,   1.69436100e+00])
>>> minVals
array([ 0.      ,  0.      ,  0.001156])
测试分类器
取原有数据的10%做交叉验证
#testing
def datingClassTest():
    hoRatio = 0.10
    datingDataMat,datingLabels = file2matrix('datingTestSet2.txt')
    normMat, ranges, minVals = autoNorm(datingDataMat)
    m = normMat.shape[0]
    numTestVecs = int(m*hoRatio)
    errorCount = 0.0
    for i in range(numTestVecs):
        classifierResult = classify0(normMat[i,:],normMat[numTestVecs:m,:],\
            datingLabels[numTestVecs:m],3)
        print "the classifier came back with: %d, the real answer is: %d" %(classifierResult,datingLabels[i])
    if (classifierResult!=datingLabels[i]):errorCount +=1.0
    print "the total error rate is: %f" %(errorCount/float(numTestVecs))
程序运行
>>> reload(kNN)
from 'kNN.py'>
>>> kNN.datingClassTest()
the classifier came back with: 3, the real answer is: 3
the classifier came back with: 2, the real answer is: 2
the classifier came back with: 1, the real answer is: 1
the classifier came back with: 1, the real answer is: 1
the classifier came back with: 1, the real answer is: 1
...
the classifier came back with: 3, the real answer is: 3
the classifier came back with: 3, the real answer is: 3
the classifier came back with: 2, the real answer is: 2
the classifier came back with: 1, the real answer is: 1
the classifier came back with: 3, the real answer is: 1
the total error rate is: 0.010000
>>>
最终误差为1%,效果挺好,可以使用
分类器使用
#using the classifier to classify person
def classifyPerson():
    resultList = ['not at all','in small doses','in large doses']
    percentTats = float(raw_input("percentage of time playing games?"))
    ffMiles = float(raw_input("frequent flier miles earned per year?"))
    iceCream = float(raw_input("liters of ice cream consumed per year?"))
    datingDataMat,datingLabels = file2matrix('datingTestSet2.txt')
    normMat, ranges, minVals = autoNorm(datingDataMat)
    inArr = array([percentTats,ffMiles,iceCream])
    classifierResult = classify0(inArr,normMat,datingLabels,3)
    print "You will take this person: ",resultList[classifierResult-1]
调用
>>> reload(kNN)
'kNN' from 'kNN.py'>
>>> kNN.classifyPerson()
percentage of time playing games?50
frequent flier miles earned per year?50000
liters of ice cream consumed per year?0
You will take this person:  not at all
>>>
手写识别系统
识别数字0-9,图像已经处理成32x32像素的黑白图像,用文本文件格式存储,如,3_89.txt存的就是数字3的图像

trainingDigits目录下大约有2000个这样的训练数据,每个数字200个
testDigits目录下大约有900个测试数据
数据准备
为了能使用最开始定义的分类器,将32x32的二进制图像转换成1x1024的向量
def img2vector(filename):
    returnVect = zeros((1,1024))
    fr = open(filename)
    for i in range(32):
        lineStr = fr.readline()
        for j in range(32):
            returnVect[0,32*i+j] = int(lineStr[j])
    return returnVect
运行
>>> reload(kNN)
'kNN' from 'kNN.py'>
>>> testVector = kNN.img2vector('testDigits/0_13.txt')
>>> testVector[0,0:16]
array([ 0.,  0.,  0.,  0.,  0.,  0.,  0.,  0.,  0.,  0.,  0.,  0.,  0.,
        0.,  1.,  1.])
使用k近邻算法识别手写数字
def handwritingClassTest():
    hwLabels = []
    trainingFileList = listdir('trainingDigits')           #load the training set
    m = len(trainingFileList)
    trainingMat = zeros((m,1024))
    for i in range(m):
        fileNameStr = trainingFileList[i]
        fileStr = fileNameStr.split('.')[0]     #take off .txt
        classNumStr = int(fileStr.split('_')[0])
        hwLabels.append(classNumStr)
        trainingMat[i,:] = img2vector('trainingDigits/%s' % fileNameStr)
    testFileList = listdir('testDigits')        #iterate through the test set
    errorCount = 0.0
    mTest = len(testFileList)
    for i in range(mTest):
        fileNameStr = testFileList[i]
        fileStr = fileNameStr.split('.')[0]     #take off .txt
        classNumStr = int(fileStr.split('_')[0])
        vectorUnderTest = img2vector('testDigits/%s' % fileNameStr)
        classifierResult = classify0(vectorUnderTest, trainingMat, hwLabels, 3)
        print "the classifier came back with: %d, the real answer is: %d" % (classifierResult, classNumStr)
        if (classifierResult != classNumStr): errorCount += 1.0
    print "\nthe total number of errors is: %d" % errorCount
    print "\nthe total error rate is: %f" % (errorCount/float(mTest))
运行
>>> reload(kNN)
from 'kNN.py'>
>>> kNN.datingClassTest()
the classifier came back with: 6, the real answer is: 6
the classifier came back with: 0, the real answer is: 0
the classifier came back with: 8, the real answer is: 8
the classifier came back with: 5, the real answer is: 5
...
the classifier came back with: 3, the real answer is: 3
the classifier came back with: 3, the real answer is: 3
the classifier came back with: 2, the real answer is: 2
the classifier came back with: 9, the real answer is: 9
the classifier came back with: 0, the real answer is: 0

the total number of errors is: 13

the total error rate is: 0.013742
>>>
错误率为1.3%
但实际使用时,算法的执行效率不够高,需要为每个测试向量做2000次距离计算,每个距离计算包括了1024个维度浮点运算,总共要执行900次;还要为测试向量准备2MB的存储空间
时间和空间复杂度过高
未完,待续
参考资料《机器学习实战[美]PETER HARRINGTON》

