Python-Matplotlib包的使用
文章目录
- 一、散点图
- 1.语法
- 2.参数解释
- 3.示例
- 二、折线图
- 1.语法
- 2.参数解释
- 3.示例
- 三、条形图
- 1.语法
- 2.参数解释
- 3.示例
- 四、直方图
- 1.语法
- 2.参数说明
- 3.示例
- 五、饼状图
- 1.语法
- 2.参数解释
- 3.示例
- 六、箱型图
- 1.语法
- 2.参数解释
- 3.示例
- 七、颜色和样式
- 1.颜色
- ①八种内键默认颜色缩写
- ②其他颜色表示方法
- 2.点、线的样式
- ①点形状
- ②四种线型
- 3.样式字符串
- 八、子图
- 1.语法
- 2.示例
- 九、多图
- 十、网格
- 十一、图例
- 方法 1
- 方法 2
- 方法 3
- 十二、坐标轴
- 1.坐标轴范围
- 方法 1
- 方法 2
- 2.坐标轴刻度
- 3.添加坐标轴
- 十三、添加注释
- 参数解释
- 十四、添加文字
- 参数解释
- 十五、Tex公式
- 十六、区域填充
- fill 用法
- fill_between 用法
- 十七、图形美化
- 语法
Matplotlib 官方文件参考网址:https://matplotlib.org/index.html
一、散点图
1.语法
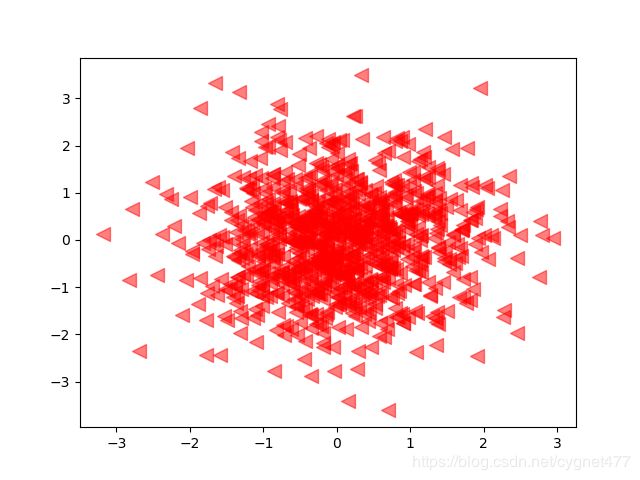
plt.scatter(x,y,s=100,c=‘r’,marker=’<’,alpha=‘0.5’)
2.参数解释
- s:点的大小
- c:点颜色
- marker:点形状
- alpha: 点的透明度
3.示例
x=np.random.randn(1000)
y1=np.random.randn((1000))
plt.scatter(x,y1,s=100,c='r',marker='<',alpha='0.5')
plt.show()
二、折线图
1.语法
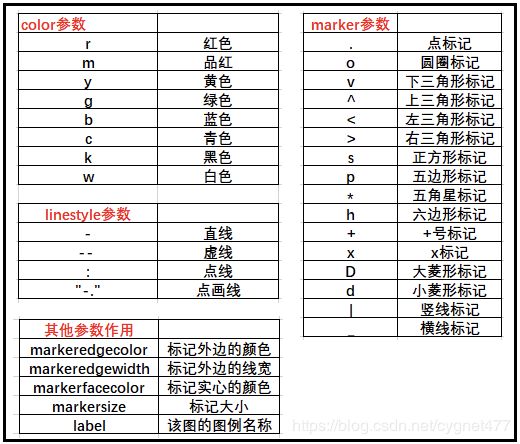
plot(x,y,‘格式’)
2.参数解释
3.示例
#linspace为生成等区间的数值
x=np.linspace(-10,10,20)
y=x**2
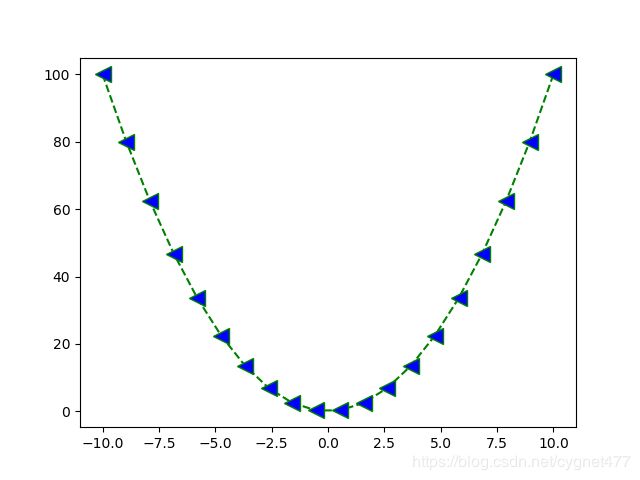
plt.plot(x,y,color='green', linestyle='dashed', marker='<',
     markerfacecolor='blue', markersize=12)
plt.savefig('折线图')
plt.show()
三、条形图
1.语法
垂直方向:
plt.bar(x,height,color,edgecolor,width=0.8,bottom=None,align=‘center’)
水平方向:
plt.bar(x=0,height,color,edgecolor,width=0.8,bottom,align=‘center’,orientation=‘horizontal’)
2.参数解释
- left:条图最左边的横坐标
- color:条形图颜色。
- edgecolor:条图边缘颜色。
- width:条图宽度,可以相同,可以不同。
- bottom :条图底部位置。
- align:柱子的位置与x值的对应关系。center:条图位于x值的中心位置,edge:表示条图位于x值的边缘位置
- orientation:horizontal代表绘制水平方向的条形图
3.示例
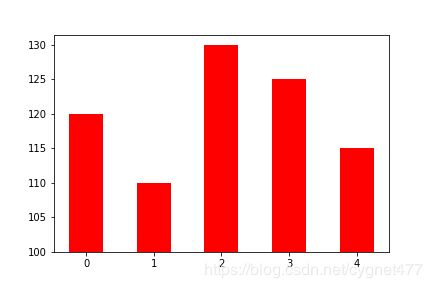
示例 1:普通条形图
N=5
y=[20,10,30,25,15]
index = np.arange(N)
p1 = plt.bar(x=index, height=y,width=0.5,bottom=100,color='red')
plt.savefig('条形图')
plt.show()
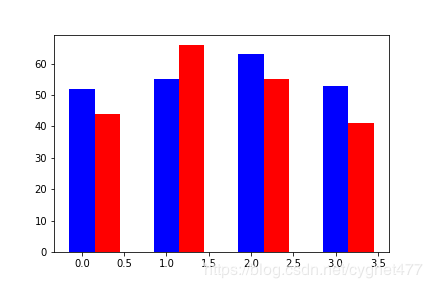
index = np.arange(4)
sales_BJ=[52,55,63,53]
sales_SH=[44,66,55,41]

bar_width=0.3

plt.bar(index,sales_BJ,bar_width,color='b')
plt.bar(index+bar_width,sales_SH,bar_width,color='r')
plt.savefig('并列条形图')
plt.show()
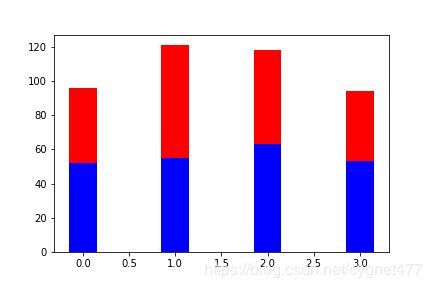
plt.bar(index,sales_BJ,bar_width,color='b')
plt.bar(index,sales_SH,bar_width,color='r',bottom=sales_BJ)
plt.savefig('层叠条形图')
plt.show()
四、直方图
1.语法
plt.hist(x,bins=10,color=‘red’,normed=True)
2.参数说明
- x 表示要绘图的数据
- bins 每个部分显示的标签
- colors 指定直方图颜色
- normed 是否对数据标准化
3.示例
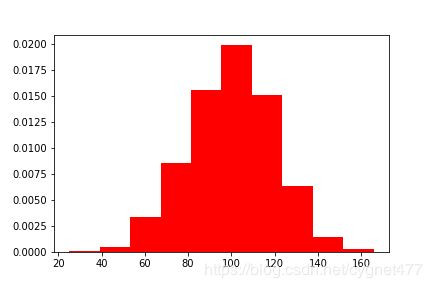
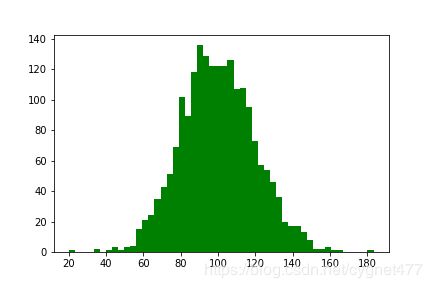
示例 1:标准化直方图,返回 y 轴为x频率
mu = 100  # mean of distribution
sigma = 20  # standard deviation of distribution
x = mu + sigma * np.random.randn(2000)
plt.savefig('直方图')
plt.hist(x, bins=10,color='red',normed=True)
plt.hist(x, bins=50,color='green',normed=False)
plt.savefig('非标准化直方图')
plt.show()
五、饼状图
1.语法
plt.pie(x,y,height,color,edgecolor,width=0.8,bottom=None,align=“center”)
2.参数解释
- x 表示要绘图的数据。
- labels 每个部分显示的标签。
- explode 指定每个部分距离圆心的偏移量(单位为半径的长度)。
- colors 指定每个部分的颜色。
- autopct 设置每个部分显示的比例值(格式化)。
- counterclock 是否逆时针绘图。默认为True。
- startangle 初始绘图点位置(逆时针偏移x轴的角度),默认为偏移0度(x轴)。
- shadow 是否含有阴影,默认为False。(用处不大)
注意:默认绘制饼状图为椭圆形,如要使其为原型,需添加:plt.axes(aspect=1)
3.示例
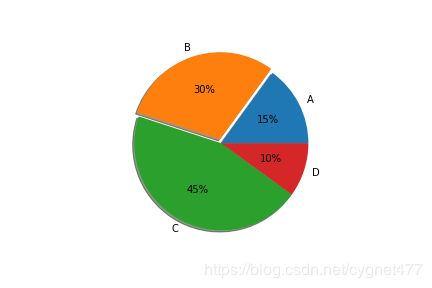
labels = 'A', 'B', 'C', 'D'
fracs = [15, 30, 45, 10]
explode = (0, 0.05, 0, 0)
plt.axes(aspect=1)
plt.pie(fracs, explode=explode, labels=labels, autopct='%.0f%%', shadow=True)
plt.savefig('饼状图')
plt.show()
六、箱型图
1.语法
plt.boxplot(data,sym=‘o’,whis=1.5)
2.参数解释
- sym 异常点的形状
- whis 虚线的长度比例
3.示例
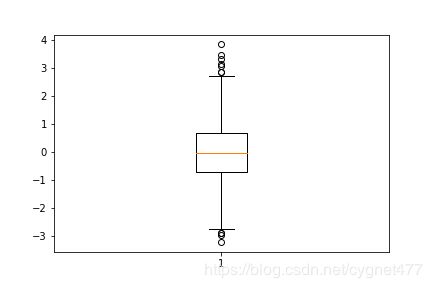
np.random.seed(100)
data = np.random.normal(size=1000, loc=0.0, scale=1.0)
plt.boxplot(data,sym='o',whis=1.5)
plt.savefig('箱型图')
plt.show()
七、颜色和样式
1.颜色
①八种内键默认颜色缩写
- b-blue
- g-green
- r-red
- c-cyan
- m-magenta
- y-yellow
- k-black
- w-white
②其他颜色表示方法
- 灰色阴影
color 参数+数字
y=np.arrange(1,5)
plt.plot(y,color='0.5')
plt.show()
- html 十六进制
y=np.arrange(1,5)
plt.plot(y,color='#FF00FF')
plt.show()
- RGB 元组
y=np.arrange(1,5)
plt.plot(y,color=(0.1,0.2,0.3))
plt.show()
2.点、线的样式
①点形状
不同点形状默认使用不同颜色
- “.” Point marker
- “,” Pixel marker
- “o” Circle marker
- “v” Triangle down marker
- “^” Triangle up marker
- ”<” Triangle left marker
- “>” Triangle right marker
- “1“ Tripod down marker
- “2“ Tripod up marker
- “3“ Tripod left marker
- “4“ Tripod right marker
- “s“ Square marker
- “p“ Pentagon marker
- “*“ Star marker
- “h“ Hexagon marker
- “H“ Rotated hexagon D Diamond marker
- “d “ Thin diamond marker
- “| “ Vertical line (vlinesymbol) marker
- “_ “ Horizontal line (hline symbol) marker
- “+“ Plus marker
- “x“ Cross (x) marker
②四种线型
- “ - “ 实线
- “ – “ 虚线
- “ -. “ 虚点相间
- “ : “ 点线
3.样式字符串
可以将颜色、点型、线型写成一个字符串,如:
- cx–
- mo:
- kp-
八、子图
1.语法
fig=plt.figure()
plt.subplot(参数1参数2参数3)
plt.plot(x,x)
2.示例
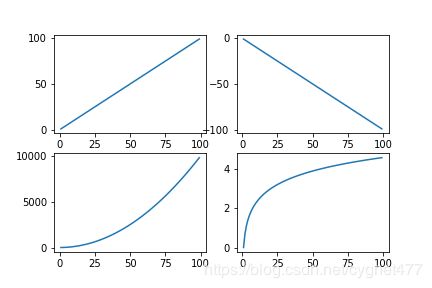
x=np.arange(1,100)

plt.subplot(221)
plt.plot(x,x)

plt.subplot(222)
plt.plot(x,-x)

plt.subplot(223)
plt.plot(x,x*x)

plt.subplot(224)
plt.plot(x,np.log(x))

plt.show()
九、多图
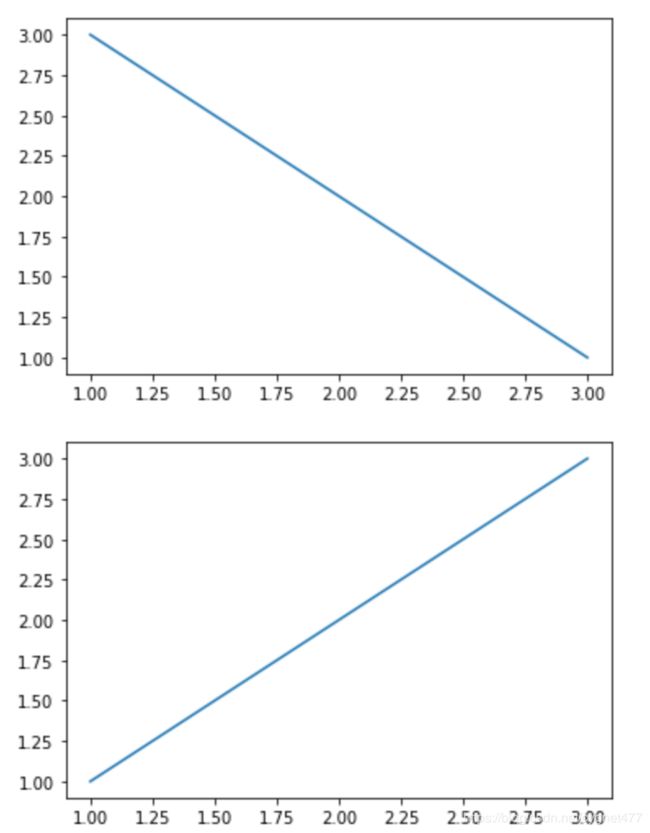
import matplotlib.pyplot as plt

fig1=plt.figure()
ax1=fig1.add_subplot(111)
ax1.plot([1,2,3],[3,2,1])

fig2=plt.figure()
ax2=fig2.add_subplot(111)
ax2.plot([1,2,3],[1,2,3])

plt.show()
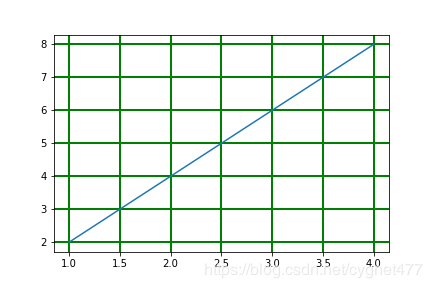
十、网格
y=np.arange(1,5)
plt.plot(y,y*2)

plt.grid(True,color='g',linestyle='-',linewidth='2')

plt.savefig('网格2')
plt.show()
十一、图例
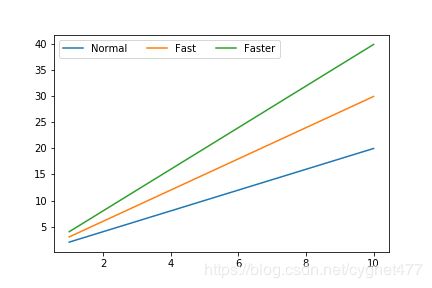
方法 1
- label :代表每条线的名字
- legend:
loc 代表图例所在位置,从右上角至右下角逆时针分别为 1,2,3,4;
ncol 代表一行所显示的图例的个数
x=np.arange(1,11,1)
y=x*x

plt.plot(x,x*2,label='Normal')
plt.plot(x,x*3,label='Fast')
plt.plot(x,x*4,label='Faster')
plt.legend(loc=2,ncol=3)

plt.show()
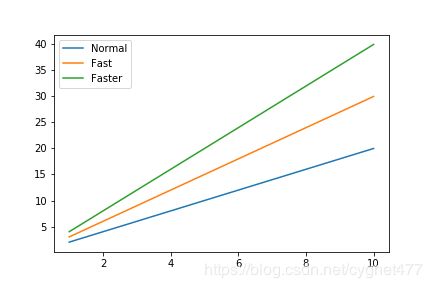
方法 2
plt.plot(x,x*2)
plt.plot(x,x*3)
plt.plot(x,x*4)

plt.legend(['Normal','Fast','Faster'])

plt.savefig('图例1')
plt.show()
方法 3
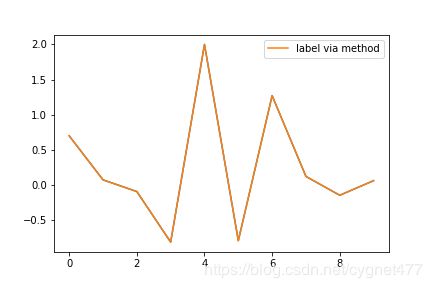
x=np.arange(0,10,1)
y=np.random.randn(len(x))

fig=plt.figure()
ax=fig.add_subplot(111)
l,=plt.plot(x,y)

ax.legend(['ax legend'])

line, =ax.plot(x,y,label='Inline label')

line.set_label('label via method')

ax.legend()

plt.show()
十二、坐标轴
1.坐标轴范围
方法 1
语法:
- plt.axis([x1,x2,y1,y2])
- 表示绘制图表 X轴在 x1-x2 范围内,Y轴在 y1-y2 范围内。
方法 2
语法:
- plt.xlim([x1,x2])
- plt.ylim([y1,y2])
2.坐标轴刻度
3.添加坐标轴
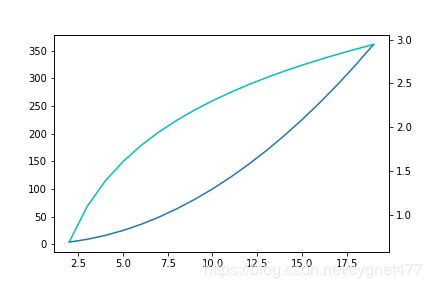
- 示例 1:
x=np.arange(2,20,1)
y1=x*x
y2=np.log(x)

plt.plot(x,y1)
plt.twinx()
plt.plot(x,y2,color='c')
plt.savefig('双坐标轴1')
plt.show()
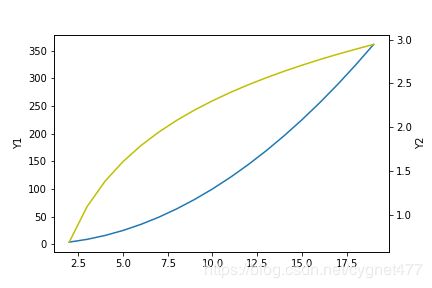
- 示例 2
x=np.arange(2,20,1)
y1=x*x
y2=np.log(x)

fig=plt.figure()
ax1=fig.add_subplot(111)
ax1.plot(x,y1)
ax1.set_ylabel('Y1')

ax2=ax1.twinx()
ax2.plot(x,y2,color='y')
ax2.set_ylabel('Y2')

plt.savefig('双坐标轴2')
plt.show()
十三、添加注释
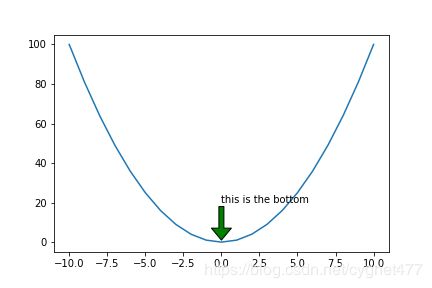
x=np.arange(-10,11,1)
y=x*x

plt.plot(x,y)
plt.annotate('this is the bottom',xy=(0,1),xytext=(0,20),
            arrowprops=dict(facecolor='g',frac=0.2,headwidth=20,width=5))

plt.savefig('添加注释')
plt.show()
参数解释
- xy 箭头底部所在点的坐标
- xytext 文字起始位置所在点坐标
- arrowprops 箭头相关参数
- facecolor 箭头颜色
- frac 三角箭头长度/整体箭头长度比值
- headwidth 三角箭头宽度
- width 箭身宽度
十四、添加文字
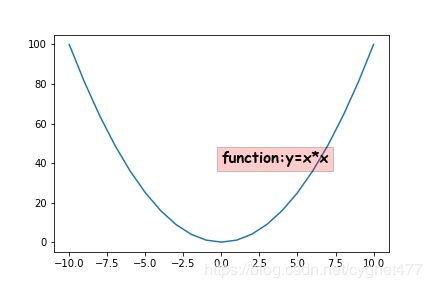
x=np.arange(-10,11,1)
y=x*x

plt.plot(x,y)

plt.text(0,40,'function:y=x*x',
         family='fantasy',size=15,
         color='k',style='italic',weight=1000,
         bbox=dict(facecolor='r',alpha=0.2))

plt.savefig('添加文字')
plt.show()
参数解释
- x,y 文字所在坐标轴位置
- family 字体
- size 字体大小
- color 字体颜色
- style 字体风格(斜体’italic’或正常‘normal’)
- weight 加粗程度
- bbox 边框参数
- facecolor 边框填充颜色
- alpha 边框透明度
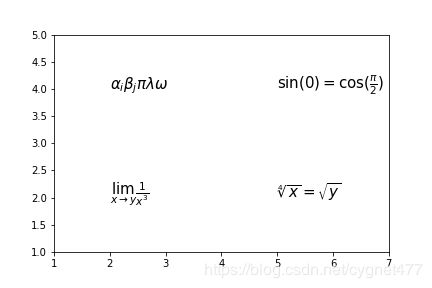
十五、Tex公式
fig=plt.figure()

ax=fig.add_subplot(111)

ax.set_xlim([1,7])
ax.set_ylim([1,5])

ax.text(2,4,r'$ \alpha_i \beta_j \pi \lambda \omega$',size=15)
ax.text(5,4,r'$ \sin(0)=\cos(\frac{\pi}{2})$',size=15)
ax.text(2,2,r'$ \lim_{x\rightarrow y}\frac{1}{x^3}$',size=15)
ax.text(5,2,r'$ \sqrt[4]{x}=\sqrt{y}$',size=15)

plt.savefig('Tex公式')
plt.show()
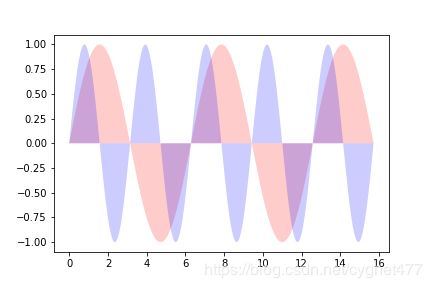
十六、区域填充
fill 用法
x=np.linspace(0,5*np.pi,1000)
y1=np.sin(x)
y2=np.sin(2*x)

plt.fill(x,y1,'r',alpha=0.2)
plt.fill(x,y2,'b',alpha=0.2)

plt.savefig('区域填充')
plt.show()
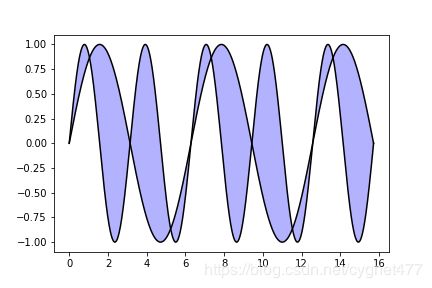
fill_between 用法
x=np.linspace(0,5*np.pi,1000)
y1=np.sin(x)
y2=np.sin(2*x)

fig=plt.figure()
ax=plt.gca()
ax.plot(x,y1,x,y2,color='black')

ax.fill_between(x,y1,y2,facecolor='blue',alpha=0.3)


plt.savefig('区域填充1')
plt.show()
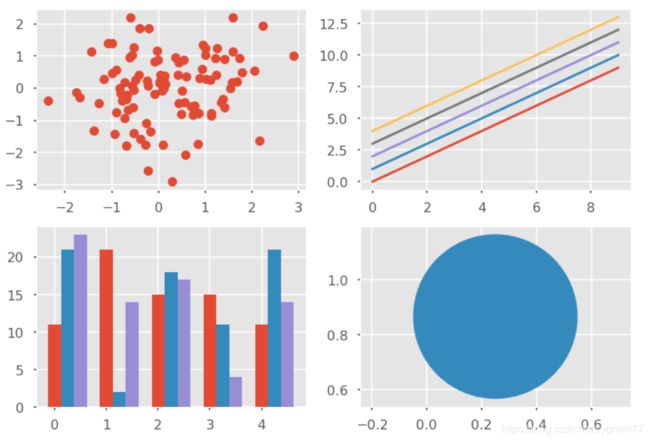
十七、图形美化
语法
内置美化函数:plt.style.use('ggplot)
style中可用参数有:
‘seaborn-dark’,
‘seaborn-darkgrid’,
‘seaborn-ticks’,
‘fivethirtyeight’,
‘seaborn-whitegrid’,
‘classic’,
‘_classic_test’,
‘fast’,
‘seaborn-talk’,
‘seaborn-dark-palette’,
‘seaborn-bright’,
‘seaborn-pastel’,
‘grayscale’,
‘seaborn-notebook’,
‘ggplot’,
‘seaborn-colorblind’,
‘seaborn-muted’,
‘seaborn’,
‘Solarize_Light2’,
‘seaborn-paper’,
‘bmh’,
‘tableau-colorblind10’,
‘seaborn-white’,
‘dark_background’,
‘seaborn-poster’,
‘seaborn-deep’
plt.style.use('ggplot')
fig, axes=plt.subplots(ncols=2,nrows=2)
ax1,ax2,ax3,ax4=axes.ravel()

x,y=np.random.normal(size=(2,100))
ax1.plot(x,y,'o')

s=1
x=np.arange(0,10)
y1=np.arange(0,10)
y2=np.arange(s,10+s)
y3=np.arange(2*s,10+2*s)
y4=np.arange(3*s,10+3*s)
y5=np.arange(4*s,10+4*s)
ax2.plot(x,y1,'-')
ax2.plot(x,y2,'-')
ax2.plot(x,y3,'-')
ax2.plot(x,y4,'-')
ax2.plot(x,y5,'-')

x=np.arange(5)
y1,y2,y3=np.random.randint(1,25,size=(3,5))
width=0.25
ax3.bar(x,y1,width)
ax3.bar(x+width,y2,width)
ax3.bar(x+2*width,y3,width)

xy=np.random.normal(size=2)
ax4.add_patch(plt.Circle(xy,radius=0.3))
ax4.axis('equal')

plt.savefig('美化')
plt.show()
