数据可视化实战——线条、颜色、背景、字体、标记、图例的设置与基本可视化图形的绘制
上篇我们学习了数据清洗
python数据清洗与预处理实战
现在我们来学习数据可视化
探索性数据分析(Explore data analysis)
EDA一定程度上跟描述性数据分析重合,但范围要大于描述性数据分析
探索性数据分析:
- 不清楚数据长什么样
- 不知道数据里有什么
- 目标不甚明确:大目标清晰,中间途径不清晰
- 从数据中找到线索
- EDA是一种方法论而不是特定技术
探索性数据分析的基本面:
- 定量分析展示
- 统计绘图与数据可视化
探索性数据分析的具体方法:
- 数据基本概况(统计定量分析)
- 缺失值展示与探索
- 异常值和离群点展示与探索
- 目标变量重点分析
- 自变量逐变量分析(数值型、分类型、文本特征)
- 自变量目标变量相关分析
- 统计绘图与可视化展示
统计绘图与数据可视化
现代统计图形(最常用)
- 柱状图/条形图:单变量/多变量
- 散点图:单变量/多变量
- 直方图:单变量,尤其是数值型目标变量的分布展示
- 箱线图:离散变量与连续变量的关系展示
- 折线图:单变量/多变量
- 密度图:和直方图联用
数据可视化技术
- 统计图形
- R语言可视化:ggplot2
- python可视化:matplotlib/seaborn/bokeh/plotly/wordcloud
- web可视化:交互式绘图/echarts/javascript/D3.js
- 地图可视化
对于数据分析和机器学习而言,掌握前三个即可,重点在于各种统计图形。
Python统计绘图:matplotlib
import matplotlib as mpl
import matplotlib.pyplot as plt
import numpy as np
import warnings
warnings.filterwarnings('ignore')

plt.style.use('classic')
%matplotlib inline
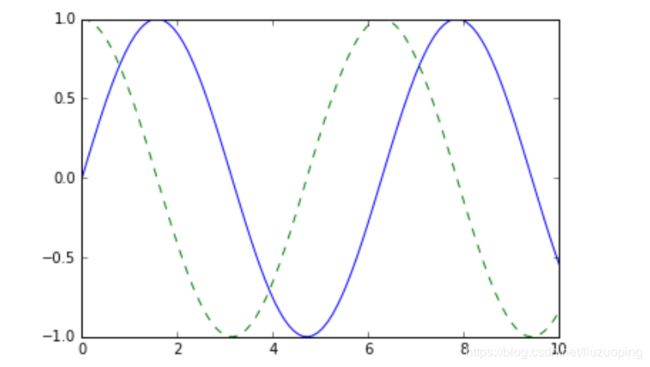
# first little example
x = np.linspace(0, 10, 100)

fig = plt.figure()
plt.plot(x, np.sin(x), '-')
plt.plot(x, np.cos(x), '--')
plt.show()
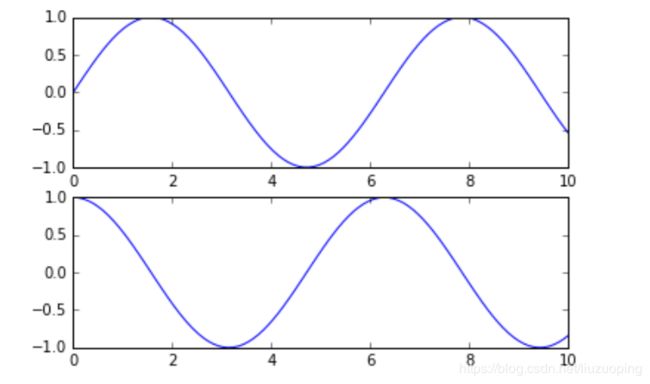
# matlab-style interface
plt.figure()
# create the first of two panels and set current axis
plt.subplot(2, 1, 1) # (rows, columns, panel number)
plt.plot(x, np.sin(x))

# create the second panel and set current axis
plt.subplot(2, 1, 2)
plt.plot(x, np.cos(x))
plt.show()
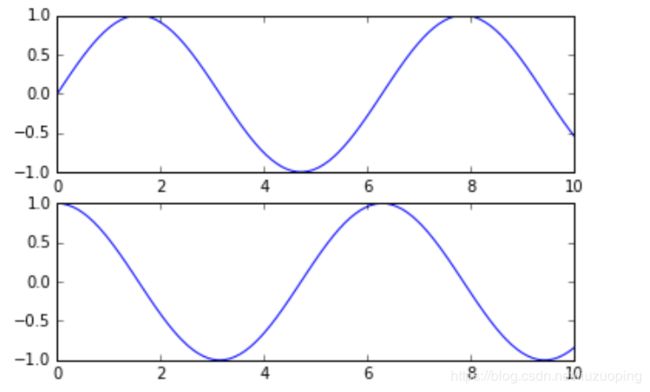
# Object-oriented interface
# ax will be an array of two Axes objects
fig, ax = plt.subplots(2)

# Call plot() method on the appropriate object
ax[0].plot(x, np.sin(x))
ax[1].plot(x, np.cos(x))
plt.show()
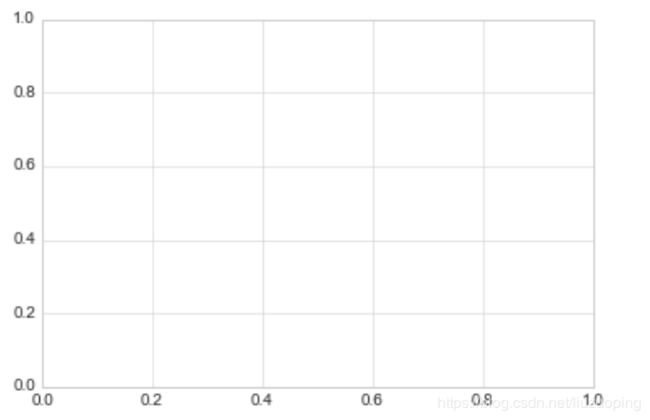
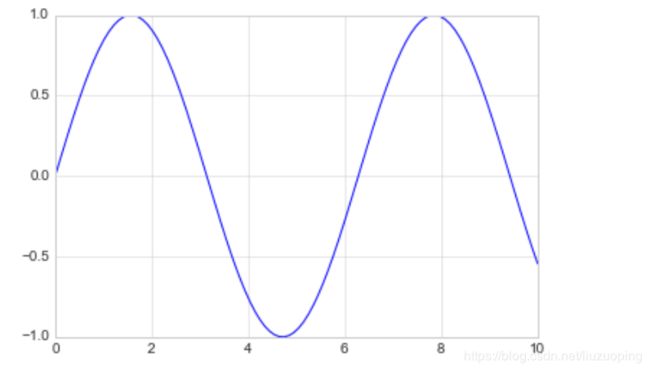
# 底图风格
plt.style.use('seaborn-whitegrid')
fig = plt.figure()
ax = plt.axes()
plt.figure()
ax = plt.axes()

x = np.linspace(0, 10, 100)
ax.plot(x, np.sin(x))
plt.show()
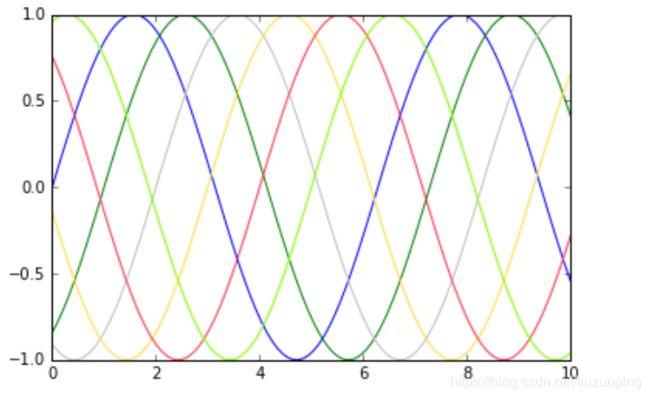
# 颜色调整
plt.plot(x, np.sin(x - 0), color='blue')        # specify color by name
plt.plot(x, np.sin(x - 1), color='g')           # short color code (rgbcmyk)
plt.plot(x, np.sin(x - 2), color='0.75')        # Grayscale between 0 and 1
plt.plot(x, np.sin(x - 3), color='#FFDD44')     # Hex code (RRGGBB from 00 to FF)
plt.plot(x, np.sin(x - 4), color=(1.0,0.2,0.3)) # RGB tuple, values 0 to 1
plt.plot(x, np.sin(x - 5), color='chartreuse')  # all HTML color names supporte
plt.show()
# 线条样式
plt.plot(x, x + 0, linestyle='solid')
plt.plot(x, x + 1, linestyle='dashed')
plt.plot(x, x + 2, linestyle='dashdot')
plt.plot(x, x + 3, linestyle='dotted');

# For short, you can use the following codes:
plt.plot(x, x + 4, linestyle='-')  # solid
plt.plot(x, x + 5, linestyle='--') # dashed
plt.plot(x, x + 6, linestyle='-.') # dashdot
plt.plot(x, x + 7, linestyle=':')  # dotted
plt.show()
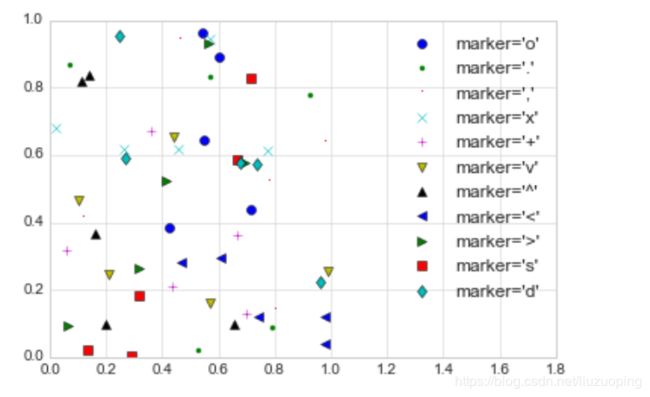
# 标记展示
rng = np.random.RandomState(0)
for marker in ['o', '.', ',', 'x', '+', 'v', '^', '<', '>', 's', 'd']:
    plt.plot(rng.rand(5), rng.rand(5), marker,
             label="marker='{0}'".format(marker))
plt.legend(numpoints=1)
plt.xlim(0, 1.8)
plt.show()
 前面学会了设置颜色,背景以及线条样式与标记样式
现在我们来绘制实际图例
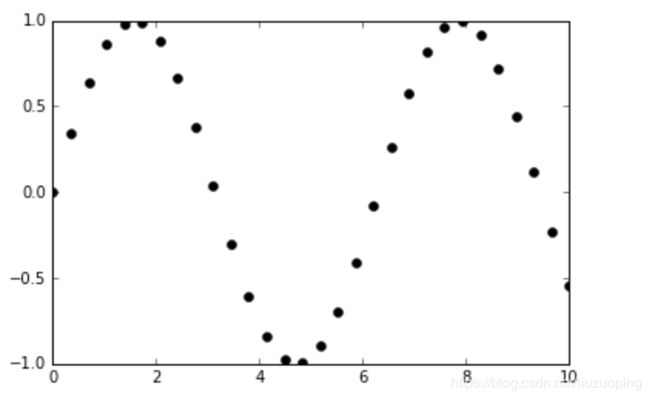
散点图
# 散点图
x = np.linspace(0, 10, 30)
y = np.sin(x)
plt.plot(x, y, 'o', color='black')
plt.show()
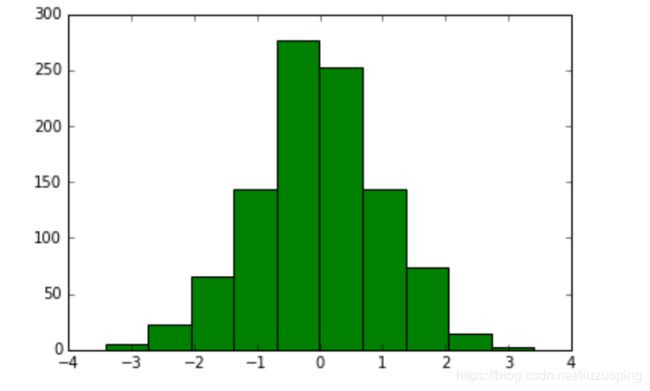
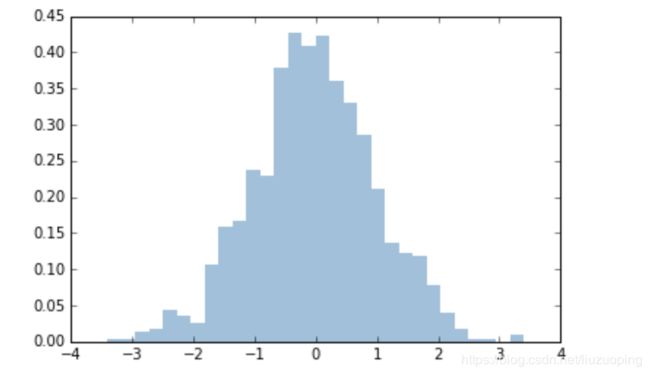
直方图
# 直方图
data = np.random.randn(1000)
plt.hist(data,color='g')
plt.show()
plt.hist(data, bins=30, normed=True, alpha=0.5,
         histtype='stepfilled', color='steelblue',
         edgecolor='none')
plt.show()
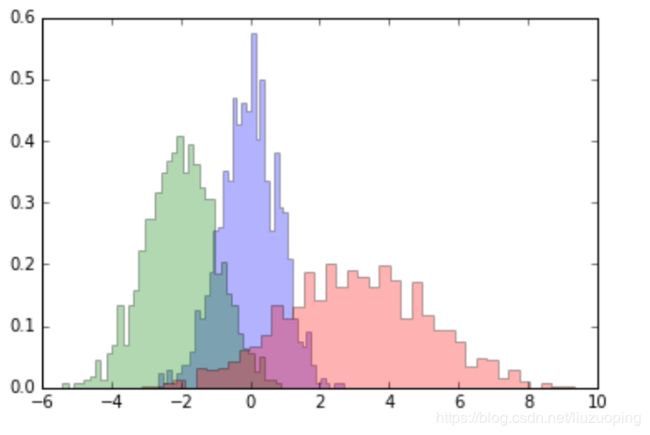
x1 = np.random.normal(0, 0.8, 1000)
x2 = np.random.normal(-2, 1, 1000)
x3 = np.random.normal(3, 2, 1000)

kwargs = dict(histtype='stepfilled', alpha=0.3, normed=True, bins=40)

plt.hist(x1, **kwargs)
plt.hist(x2, **kwargs)
plt.hist(x3, **kwargs);
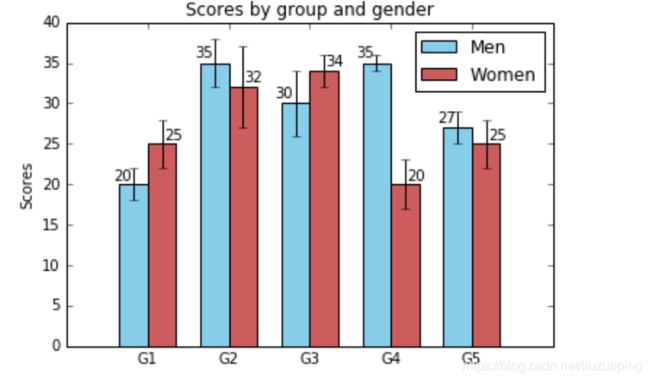
柱状图
men_means, men_std = (20, 35, 30, 35, 27), (2, 3, 4, 1, 2)
women_means, women_std = (25, 32, 34, 20, 25), (3, 5, 2, 3, 3)

ind = np.arange(len(men_means))  # the x locations for the groups
width = 0.35  # the width of the bars

fig, ax = plt.subplots()
rects1 = ax.bar(ind - width/2, men_means, width, yerr=men_std,
                color='SkyBlue', label='Men')
rects2 = ax.bar(ind + width/2, women_means, width, yerr=women_std,
                color='IndianRed', label='Women')

# Add some text for labels, title and custom x-axis tick labels, etc.
ax.set_ylabel('Scores')
ax.set_title('Scores by group and gender')
ax.set_xticks(ind)
ax.set_xticklabels(('G1', 'G2', 'G3', 'G4', 'G5'))
ax.legend()


def autolabel(rects, xpos='center'):
    """
    Attach a text label above each bar in *rects*, displaying its height.

    *xpos* indicates which side to place the text w.r.t. the center of
    the bar. It can be one of the following {'center', 'right', 'left'}.
    """

    xpos = xpos.lower()  # normalize the case of the parameter
    ha = {'center': 'center', 'right': 'left', 'left': 'right'}
    offset = {'center': 0.5, 'right': 0.57, 'left': 0.43}  # x_txt = x + w*off

    for rect in rects:
        height = rect.get_height()
        ax.text(rect.get_x() + rect.get_width()*offset[xpos], 1.01*height,
                '{}'.format(height), ha=ha[xpos], va='bottom')


autolabel(rects1, "left")
autolabel(rects2, "right")

plt.show()
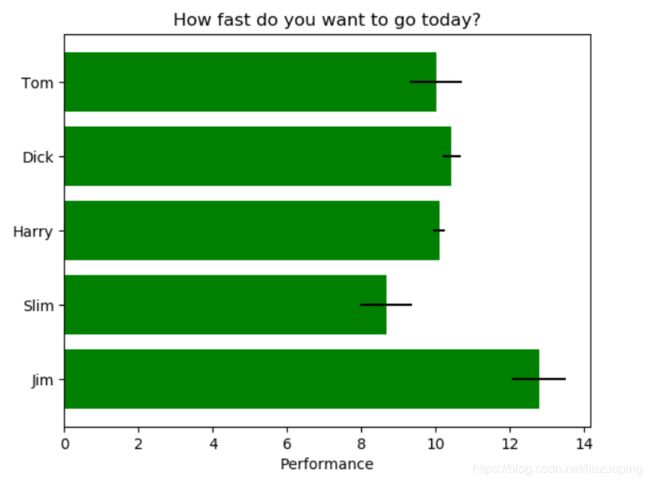
条形图/水平柱状图
np.random.seed(19680801)
plt.rcdefaults()
fig, ax = plt.subplots()

# Example data
people = ('Tom', 'Dick', 'Harry', 'Slim', 'Jim')
y_pos = np.arange(len(people))
performance = 3 + 10 * np.random.rand(len(people))
error = np.random.rand(len(people))

ax.barh(y_pos, performance, xerr=error, align='center',
        color='green', ecolor='black')
ax.set_yticks(y_pos)
ax.set_yticklabels(people)
ax.invert_yaxis()  # labels read top-to-bottom
ax.set_xlabel('Performance')
ax.set_title('How fast do you want to go today?')

plt.show()
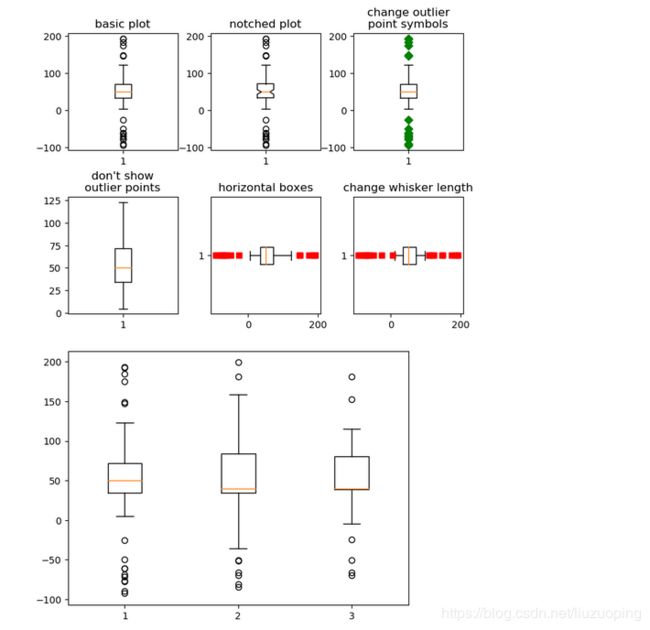
箱线图
from matplotlib.patches import Polygon

# Fixing random state for reproducibility
np.random.seed(19680801)
# fake up some data
spread = np.random.rand(50) * 100
center = np.ones(25) * 50
flier_high = np.random.rand(10) * 100 + 100
flier_low = np.random.rand(10) * -100
data = np.concatenate((spread, center, flier_high, flier_low))
fig, axs = plt.subplots(2, 3)

# basic plot
axs[0, 0].boxplot(data)
axs[0, 0].set_title('basic plot')

# notched plot
axs[0, 1].boxplot(data, 1)
axs[0, 1].set_title('notched plot')

# change outlier point symbols
axs[0, 2].boxplot(data, 0, 'gD')
axs[0, 2].set_title('change outlier\npoint symbols')

# don't show outlier points
axs[1, 0].boxplot(data, 0, '')
axs[1, 0].set_title("don't show\noutlier points")

# horizontal boxes
axs[1, 1].boxplot(data, 0, 'rs', 0)
axs[1, 1].set_title('horizontal boxes')

# change whisker length
axs[1, 2].boxplot(data, 0, 'rs', 0, 0.75)
axs[1, 2].set_title('change whisker length')

fig.subplots_adjust(left=0.08, right=0.98, bottom=0.05, top=0.9,
                    hspace=0.4, wspace=0.3)

# fake up some more data
spread = np.random.rand(50) * 100
center = np.ones(25) * 40
flier_high = np.random.rand(10) * 100 + 100
flier_low = np.random.rand(10) * -100
d2 = np.concatenate((spread, center, flier_high, flier_low))
data.shape = (-1, 1)
d2.shape = (-1, 1)
# Making a 2-D array only works if all the columns are the
# same length.  If they are not, then use a list instead.
# This is actually more efficient because boxplot converts
# a 2-D array into a list of vectors internally anyway.
data = [data, d2, d2[::2, 0]]
# Multiple box plots on one Axes
fig, ax = plt.subplots()
ax.boxplot(data)

plt.show()
