高斯混合模型GMM
GMM聚类
高斯混合模型可以看做是K-means思想的一个扩展,改进了K-means的不足之处
K-means相当于在以每个簇的中心为圆点,然后画一个圆,圆内的点都属于本簇,对于两个圆交集的地方,交集内的点属于哪个簇K-means方法也没有很好地解决办法
import numpy as np
import pandas as pd
import matplotlib.pyplot as plt
import seaborn as sns
from sklearn.datasets.samples_generator import make_blobs
from sklearn.cluster import KMeans
from scipy.spatial.distance import cdist
sns.set()

X, y_true = make_blobs(n_samples=400, centers=4,
                       cluster_std=0.60, random_state=0)
X = X[:, ::-1] # flip axes for better plotting

def plot_kmeans(kmeans, X, n_clusters=4, rseed=0, ax=None):
    labels = kmeans.fit_predict(X)

    # plot the input data
    ax = ax or plt.gca()
    ax.axis('equal')
    ax.scatter(X[:, 0], X[:, 1], c=labels, s=40, cmap='viridis', zorder=2)

    # plot the representation of the KMeans model
    centers = kmeans.cluster_centers_
    radii = [cdist(X[labels == i], [center]).max()
             for i, center in enumerate(centers)]
    for c, r in zip(centers, radii):
        ax.add_patch(plt.Circle(c, r, fc='#CCCCCC', lw=3, alpha=0.5, zorder=1))

kmeans = KMeans(n_clusters=4, random_state=0)
plot_kmeans(kmeans, X)

而且,K-means还有一个特点,簇的形状必须是圆形的,很多抢矿椭圆更实用,K-mean却没办法实现:
rng = np.random.RandomState(13)
X_stretched = np.dot(X,rng.randn(2,2))
kmeans= KMeans(n_clusters=4,random_state=0)
plot_kmeans(kmeans,X_stretched)

K-means这两个缺点,簇的形状缺少灵活性,缺少重合区域的点分配的概率性,导致K-means实际运用中效果不尽人如意,高斯混合模型,通过比较每个点与所有簇的中心距离还确定分配的概率,而不仅只比较最近的簇,同时把簇的圆形边界扩展至椭圆,来弥补K-means缺陷。
高斯混合模型predict_proba方法可以看到每个点归属于某个簇的概率
from sklearn.mixture import GaussianMixture
gmm = GaussianMixture(n_components=4).fit(X)
probs = gmm.predict_proba(X)
高斯混合模型同样是一种EM算法:
1.选择初始簇中心及形状
2.重复至收敛
a.期望步骤(E-steps):为每个点找到属于每个簇的概率作为权重
b.最大化步骤(M-steps): 更新每个簇的位置,标准化,基于所有点的权重确定形状
下面可视化GMM簇的形状和位置
from matplotlib.patches import Ellipse

def draw_ellipse(position, covariance, ax=None, **kwargs):
    """Draw an ellipse with a given position and covariance"""
    ax = ax or plt.gca()

    # Convert covariance to principal axes
    if covariance.shape == (2, 2):
        U, s, Vt = np.linalg.svd(covariance)
        angle = np.degrees(np.arctan2(U[1, 0], U[0, 0]))
        width, height = 2 * np.sqrt(s)
    else:
        angle = 0
        width, height = 2 * np.sqrt(covariance)

    # Draw the Ellipse
    for nsig in range(1, 4):
        ax.add_patch(Ellipse(position, nsig * width, nsig * height,
                             angle, **kwargs))

def plot_gmm(gmm, X, label=True, ax=None):
    ax = ax or plt.gca()
    labels = gmm.fit(X).predict(X)
    if label:
        ax.scatter(X[:, 0], X[:, 1], c=labels, s=40, cmap='viridis', zorder=2)
    else:
        ax.scatter(X[:, 0], X[:, 1], s=40, zorder=2)
    ax.axis('equal')

    w_factor = 0.2 / gmm.weights_.max()
    for pos, covar, w in zip(gmm.means_, gmm.covariances_, gmm.weights_):
        draw_ellipse(pos, covar, alpha=w * w_factor)

gmm = GaussianMixture(n_components=4,covariance_type='full',random_state=0,n_init=10)
plot_gmm(gmm,X_stretched)
GMM生成数据
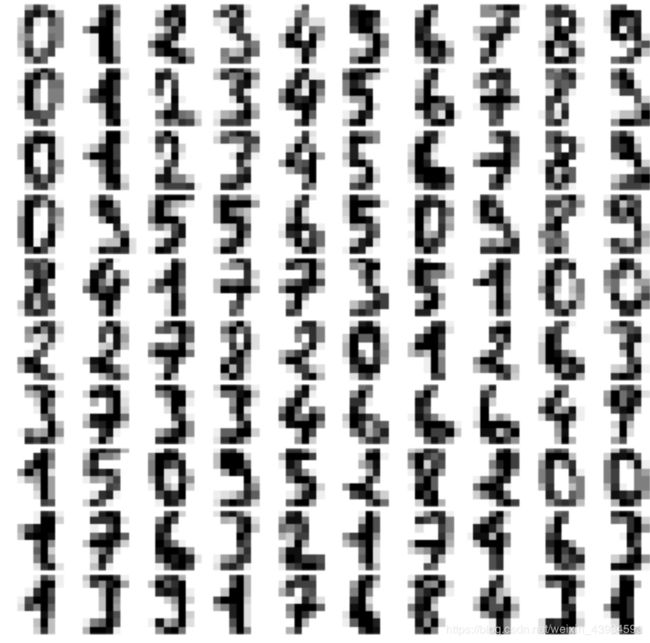
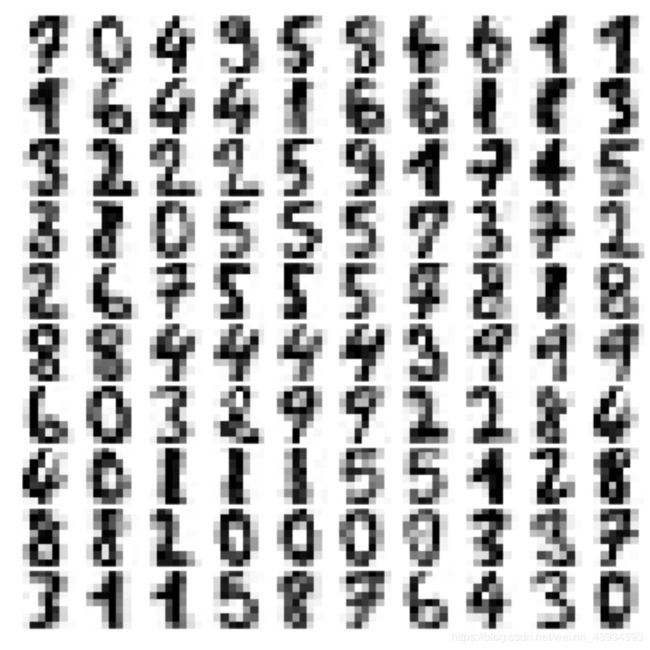
GMM本质是一个密度估计算法,他拟合的是描述数据分布的生成概率模型,GMM可以为我们生成新的,与输入数据分布类似随机分布函数。我们用scikit-learn数据工具导入手写数字,然后用GMM拟合后生成新的数字
from sklearn.datasets import load_digits
digits = load_digits()

def plot_digits(data):
    fig, ax = plt.subplots(10, 10, figsize=(8, 8),
                           subplot_kw=dict(xticks=[], yticks=[]))
    fig.subplots_adjust(hspace=0.05, wspace=0.05)
    for i, axi in enumerate(ax.flat):
        im = axi.imshow(data[i].reshape(8, 8), cmap='binary')
        im.set_clim(0, 16)
plot_digits(digits.data)

这些数字是8✖️8的像素组成的,先用PCA算法降维,保留99%方差
from sklearn.decomposition import PCA
pca =PCA(0.99,whiten=True)
data = pca.fit_transform(digits.data)
data.shape
(1797, 41)
从64维降到了41维,保留了99%的方差
使用AIC,这是一种纠正过拟合的方法,sklearn内置了,得到GMM成分数量大致估计
n_components = np.arange(40,320,10)
models = [GaussianMixture(n_components=n,covariance_type='full',random_state=0)
          for n in n_components]
aic = [model.fit(data).aic(data) for model in models]
plt.plot(n_components,aic)

当成分为140左右时,AIC最小,所以我们选择保留140成分
gmm = GaussianMixture(140,covariance_type='full',random_state=0)
gmm.fit(data)
data_new = gmm.sample(100)
digits_new = pca.inverse_transform(data_new[0])
plot_digits(digits_new)

