- Pyecharts数据可视化大屏:打造沉浸式数据分析体验
我的运维人生
信息可视化数据分析数据挖掘运维开发技术共享
Pyecharts数据可视化大屏:打造沉浸式数据分析体验在当今这个数据驱动的时代,如何将海量数据以直观、生动的方式展现出来,成为了数据分析师和企业决策者关注的焦点。Pyecharts,作为一款基于Python的开源数据可视化库,凭借其丰富的图表类型、灵活的配置选项以及高度的定制化能力,成为了构建数据可视化大屏的理想选择。本文将深入探讨如何利用Pyecharts打造数据可视化大屏,并通过实际代码案例
- pyecharts——绘制柱形图折线图
2224070247
信息可视化pythonjava数据可视化
一、pyecharts概述自2013年6月百度EFE(ExcellentFrontEnd)数据可视化团队研发的ECharts1.0发布到GitHub网站以来,ECharts一直备受业界权威的关注并获得广泛好评,成为目前成熟且流行的数据可视化图表工具,被应用到诸多数据可视化的开发领域。Python作为数据分析领域最受欢迎的语言,也加入ECharts的使用行列,并研发出方便Python开发者使用的数据
- 高级 ECharts 技巧:自定义图表主题与样式
SnowMan1993
echarts信息可视化数据分析
ECharts是一个强大的数据可视化库,提供了多种内置主题和样式,但你也可以根据项目的设计需求,自定义图表的主题与样式。本文将介绍如何使用ECharts自定义图表主题,以提升数据可视化的吸引力和一致性。1.什么是ECharts主题?ECharts的主题是指定义图表样式的配置项,包括颜色、字体、线条样式等。通过预设主题,你可以快速更改图表的整体风格,而自定义主题则允许你在此基础上进行个性化设置。2.
- nosql数据库技术与应用知识点
皆过客,揽星河
NoSQLnosql数据库大数据数据分析数据结构非关系型数据库
Nosql知识回顾大数据处理流程数据采集(flume、爬虫、传感器)数据存储(本门课程NoSQL所处的阶段)Hdfs、MongoDB、HBase等数据清洗(入仓)Hive等数据处理、分析(Spark、Flink等)数据可视化数据挖掘、机器学习应用(Python、SparkMLlib等)大数据时代存储的挑战(三高)高并发(同一时间很多人访问)高扩展(要求随时根据需求扩展存储)高效率(要求读写速度快)
- GenVisR 基因组数据可视化实战(三)
11的雾
3.genCov画每个突变位点附件的coverage,跟igv有点相似。这个操作起来很复杂,但是图还是挺有用的。可以考虑。由于我的referencegenomebuild是hg38BiocManager::install(c("TxDb.Hsapiens.UCSC.hg38.knownGene","BSgenome.Hsapiens.UCSC.hg38"))library(TxDb.Hsapien
- Python数据分析与可视化
jun778895
python数据分析开发语言
Python数据分析与可视化是一个涉及数据处理、分析和以图形化方式展示数据的过程,它对于数据科学家、分析师以及任何需要从数据中提取洞察力的专业人员来说至关重要。以下将详细探讨Python在数据分析与可视化方面的应用,包括常用的库、数据处理流程、可视化技巧以及实际应用案例。一、Python数据分析与可视化的重要性数据可视化是将数据以图形或图像的形式表示出来,以便人们能够更直观地理解数据背后的信息和规
- 【Python】tkinter及组件如何使用
小九不懂SAP
我的Python日记python开发语言tkinter
一、tkinter的应用场景tkinter是Python的标准GUI(图形用户界面)库,它提供了丰富的控件和工具,使得开发者能够轻松创建跨平台的桌面应用程序。以下是一些tkinter的常见应用场景:桌面应用程序开发:开发者可以使用tkinter来创建各种桌面应用程序,如文本编辑器、计算器、图片查看器、游戏等。这些应用程序可以具有复杂的用户界面,包括窗口、按钮、文本框、下拉菜单、滚动条等。数据可视化
- Axure科技感大屏系统设计:智慧农场管理平台
招风的黑耳
Axureaxure科技感可视化智慧农业智慧农场
在数字化转型的浪潮中,数据可视化作为连接现实世界与数字世界的桥梁,正以前所未有的速度改变着各行各业的面貌。智慧农业作为现代农业的重要发展方向,其管理平台的数据大屏设计尤为重要,它不仅是农场运营状况的直接展示窗口,更是决策支持与分析的强有力工具。AxureRP,作为一款强大的原型设计工具,凭借其高度的自定义能力和丰富的交互设计功能,成为了设计科技感十足的智慧农场管理平台大屏的理想选择。Axure在科
- R 数据可视化 —— 韦恩图
名本无名
前言对于数据集之间交叠关系的可视化,通常想到的是绘制韦恩图。韦恩图是一种关系型图表,通过图形之间的重叠来反映数据集之间的相交关系。下面,我们来简单介绍一下如何绘制韦恩图韦恩图绘制韦恩图的包有很多,比如gplots包的venn()函数、limma包的vennDiagram()函数、venneuler包的venneuler()函数。但是这些包绘制出来的图像效果都不是很好,所以我们使用比较成熟的包Ven
- 【QT教程】QT6硬件图形界面编程 QT硬件编程
QT性能优化QT原理源码QT界面美化
qtqt6.3qt5c++QT教程
QT6硬件图形界面编程使用AI技术辅助生成QT界面美化视频课程QT性能优化视频课程QT原理与源码分析视频课程QTQMLC++扩展开发视频课程免费QT视频课程您可以看免费1000+个QT技术视频免费QT视频课程QT统计图和QT数据可视化视频免费看免费QT视频课程QT性能优化视频免费看免费QT视频课程QT界面美化视频免费看1QT6硬件图形界面编程概述1.1QT6硬件图形界面编程简介1.1.1QT6硬件
- 基于VUE2-dataV和echarts实现的可视化大屏,百分比适配PC端
风流野趣fly
echarts信息可视化前端vue.jsjavascriptvscode大数据
可视化平台中,数据分别通过仪表盘、环状图、柱形图、曲线图、滚动表格等多种形式展示数据变化。可视化平台大致分为左、中、右三部分,左侧由能耗总览、耗能占比、库存预警构成,中间由数据总览、销售计划完成率构成,右侧由销售统计、销售排名(TOP8)、生产统计构成。平台右上角动态显示当前系统日期、星期、时间,格式。在管理端进行添加数据后,数据可视化图表进行相应变化。1.能耗总览仪表盘,统计分析耗电量、耗水量、
- Matlab2024a安装教程
是阿宇呢
信息可视化开发语言
MATLAB是一款商业数学软件,用于算法开发、数据可视化、数据分析以及数值计算的高级技术计算语言和交互式环境,主要包括MATLAB和Simulink两大部分,可以进行矩阵运算、绘制函数和数据、实现算法、创建用户界面、连接其他编程语言的程序等,主要应用于工程计算、控制设计、信号处理与通讯、图像处理、信号检测、金融建模设计与分析等领域。1.解压安装包:①鼠标右击【MATLABR2024a(64bit)
- 如何快速的构建企业运维可视化大屏
益达_glmsb
基于AIOps理念研发的新一代运维监大屏全盘展示IT运行状态,减轻运维人员的重复性工作量,提高IT系统排错速度,加速运维知识学习积累。图片1.png领先的数据可视化平台,把IT运维化繁为简图片2.jpg图片3.png图片4.png图片5.png图片6.png全面提升IT运维管理水平1.直接导出精美的IT运行可视化报表图片7.png2.资源分析对比图片8.png3.自动生成监控项运行“脑图”图片9.
- C# 在WPF中实现图表生成
A_nanda
WPF赏析c#wpf开发语言
在现代应用程序中,数据可视化是一个重要的功能,它可以帮助用户更直观地理解数据。在C#WPF(WindowsPresentationFoundation)中,有多种方式可以生成图表。以下是五种常见的方法,每种方法都有其独特的优势和局限。1.使用System.Windows.Shapes命名空间代码示例:<RectangleWidth="50"Height="50"Fill="Blue"Canva
- 基于Python爬虫四川成都二手房数据可视化系统设计与实现(Django框架) 研究背景与意义、国内外研究现状_django商品房数据分析论文(1)
莫莫Android开发
信息可视化python爬虫
3.国外研究现状在国外,二手房数据可视化也是一个热门的研究领域。以美国为例,有很多公司和网站提供了专门的二手房数据可视化工具,如Zillow、Redfin等。这些工具通常提供房价趋势图、房价分布图、房源信息等功能,帮助用户更好地了解房市动态。综上所述,虽然国内外在二手房数据可视化方面已经有了一些研究成果,但对于四川成都地区的二手房市场还没有相关的研究和可视化系统。因此,本研究旨在设计并实现一个基于
- 使用D3.js进行数据可视化
环能jvav大师
信息可视化前端框架javascript开发语言
D3.js介绍D3.js是一个流行的JavaScript数据可视化库,全称为Data-DrivenDocuments,即数据驱动文档。它以数据为核心,通过数据来驱动文档的展示和操作。D3.js提供了丰富的API和工具,使得开发者能够创建出各种交互式和动态的数据可视化效果。官方介绍网站:WhatisD3?|D3byObservableD3.js导入方式介绍在JavaScript中导入D3.js通常使
- Python数据分析及可视化教程--商城订单为例-适用电商相关进行数据分析---亲测可用!!!!
Dreams°123
AIGC机器学习python测试工具数据分析大数据
前言:Python是进行数据分析和可视化的强大工具,常用的库包括Pandas、NumPy、Matplotlib和Seaborn。以下是一个基本的教程概述,介绍了如何使用这些库来进行数据分析和可视化:Python数据分析及可视化教程1、环境准备2、数据准备3、开始数据分析3.1、导入库3.2、加载数据3.3、数据预处理3.4、数据分析3.5、数据可视化4、总结解释使用方法:5、错误处理和异常判断说明
- 【echarts】使用 ECharts 绘制3D饼图
帅比九日
踩过的坑前端javascriptecharts大屏端
使用ECharts绘制3D饼图在数据可视化中,饼图是表达数据占比信息的常见方式。ECharts作为一个强大的数据可视化库,除了标准的二维饼图,也支持更加生动的三维饼图绘制。本文将指导你如何使用ECharts来创建一个3D饼图,提升你的数据展示效果。首先了解3D饼图的构成在ECharts中,3D饼图主要是通过surface类型的图表来模拟实现的。一个surface类型的系列(series)可以定义一
- 【面试系列】Spark 高频面试题解答
野老杂谈
全网最全IT公司面试宝典面试spark职场和发展大数据
欢迎来到我的博客,很高兴能够在这里和您见面!欢迎订阅相关专栏:⭐️全网最全IT互联网公司面试宝典:收集整理全网各大IT互联网公司技术、项目、HR面试真题.⭐️AIGC时代的创新与未来:详细讲解AIGC的概念、核心技术、应用领域等内容。⭐️大数据平台建设指南:全面讲解从数据采集到数据可视化的整个过程,掌握构建现代化数据平台的核心技术和方法。⭐️《遇见Python:初识、了解与热恋》:涵盖了Pytho
- 开源的BI大屏设计工具
易道合之逍遥峰
开源工具信息可视化
开源的BI大屏设计工具提供了丰富的功能和灵活性,帮助用户快速构建和展示数据可视化大屏。以下是一些知名的开源BI大屏设计工具及其特点:ApacheSuperset定位:现代化的、企业级的数据探索与可视化平台。功能:提供丰富的数据源连接选项(如SQLAlchemy)和强大的可视化功能。用户可以自定义仪表板(Dashboards),快速创建数据大屏。特点:支持多种数据源,界面友好,适合有一定技术背景的用
- 10个Python办公自动化案例
Want595
python开发语言
文章目录系列目录10个Python办公自动化案例1.Excel数据读取与写入2.自动生成PDF文件3.自动发送邮件4.自动化文件重命名5.批量下载网页内容6.自动化数据可视化7.自动化文档批量处理8.批量文件压缩9.日程提醒自动化10.数据定时备份系列目录序号直达链接表白系列1Python制作一个无法拒绝的表白界面2Python满屏飘字表白代码3Python无限弹窗满屏表白代码4Python李峋同
- ES(Elasticsearch)常用的函数
遨游在知识的海洋里无法自拔
java
Elasticsearch(简称ES)是一个开源的搜索引擎,广泛用于全文搜索、分析和数据可视化。以下是一些常用的Elasticsearch函数和操作:索引操作创建索引PUT/index_name删除索引DELETE/index_name查看索引GET/index_name文档操作插入文档POST/index_name/_doc/{"field":"value"}获取文档GET/index_name
- Python自动化办公2.0 即将发布
百里图书
自动化人工智能python
第一节课:数据整理与清洗第二节课:数据筛选、过滤与排序第三节课:高级数据处理技巧第四节课:数据可视化与实践案例第五节课:统计分析与报表第六节:常见的Excel报表与下方的课程形成知识体系:Python自动化办公(面向2020,Python3.7,不断更新ing)_在线视频教程-CSDN程序员研修院https://edu.csdn.net/course/detail/28031Python机器学习教
- 【QT教程】QT6对话框编程
QT性能优化QT原理源码QT界面美化
qtqt6.3qt5c++QT教程
QT6对话框编程使用AI技术辅助生成QT界面美化视频课程QT性能优化视频课程QT原理与源码分析视频课程QTQMLC++扩展开发视频课程免费QT视频课程您可以看免费1000+个QT技术视频免费QT视频课程QT统计图和QT数据可视化视频免费看免费QT视频课程QT性能优化视频免费看免费QT视频课程QT界面美化视频免费看1QT6对话框编程基础1.1QT6对话框简介1.1.1QT6对话框简介QT6对话框简介
- Python数据可视化:25年GDP之变_基于d3
2401_84558508
程序员python信息可视化开发语言
同时还需要注意一下编码问题,这里的CSV文件需要用gbk编码。下面是从统计局下载下来的CSV数据。我偷了个懒,直接就先在表格里删除了前三行,如下。接下来便是用Python对数据进行规整,代码如下。 importpandasaspd#读取数据df=pd.read_csv(gdp.csv,encoding=utf-8)(names,values,dates)=([],[],[])#记得去除地区这个列名
- 【题目】数据分析与数据思维选择题
天启和风
大数据题目数据分析数据挖掘大数据
1.以下选项中不属于数据预处理的是()A.数据清理B.数据可视化C.数据变换D.数据集成解析:选B。数据清洗指对数据集中的不完整、不合理或不准确的数据进行修补、去重、纠错、修补或删除数据变换将原始数据变换成符合目标算法要求的数据数据集成指对来自不同的数据源的数据进行集成处理2.用来描述访问了某个项目一次就退出的次数和这个项目总访问的次数的比率的基础指标是_?A.跳失率B.费效比C.渠道转换率D.访
- Python和数据分析:Seaborn新手指南
Python_魔力猿
python数据分析信息可视化
Seaborn是建立在Matplotlib之上的统计数据可视化库,它提供了高级接口和漂亮的默认样式,使得数据可视化变得更加简单和美观。1.导论Seaborn在数据可视化中的角色和优势体现在以下方面:简化API:Seaborn的API设计更加简洁,容易使用,尤其适合初学者。它能够通过几行代码生成漂亮而具有信息含量的图表。美观的默认样式:Seaborn具有吸引人的默认颜色和样式,无需额外的配置即可生成
- Holoviews 创建复杂的可视化布局
步入烟尘
Python超入门指南全册Holoviewspython
如何使用Holoviews创建复杂的可视化布局在数据科学和数据可视化领域,Holoviews是一个非常强大的Python库,它可以帮助我们轻松地创建各种复杂的可视化布局。Holoviews提供了一个高层次的接口,使得创建交互式和静态可视化变得简单而直观。本文将介绍如何使用Holoviews来创建复杂的可视化布局,让你的数据以最直观的方式展现出来。安装Holoviews首先,确保你已经安装了Holo
- Pyecharts可视化数据大屏
七夜zippoe
大数据大数据
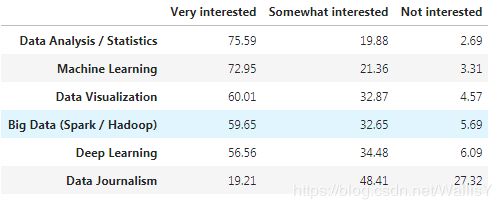
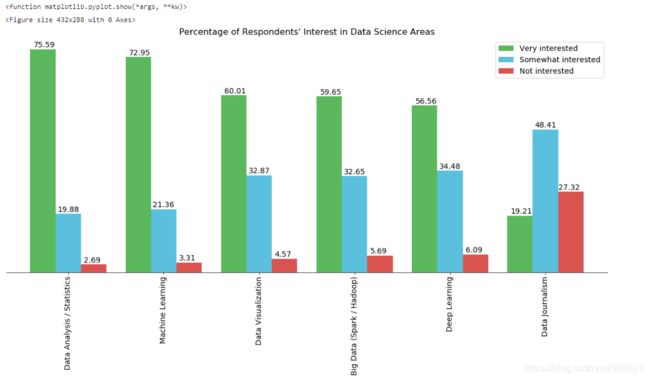
Pyecharts是一个非常强大的Python数据可视化库,它可以用来创建各种图表,并通过配置参数将这些图表组合成数据大屏。以下是创建一个简单的数据大屏的步骤和示例代码。1.安装pyecharts首先,你需要安装pyecharts:pipinstallpyecharts2.创建图表使用pyecharts创建多个图表,如柱状图、折线图等。下面是一些示例:frompyecharts.chartsimp
- 老板视角的可视化分析
qq_43696218
信息可视化数据分析数据挖掘
明明在金蝶开发了报表,老板却看也不看,因为站在老板的视角,他想要的金蝶BI数据可视化分析大概是下面这样的:1、不用等,想要的分析马上就能做到点击刷新,马上就能更新数据,自动计算指标、分析数据;在分析过程中,随时可以修改图表的汇总、行列维度,或者自行筛选数据做分析,又或者立即针对某维度数据展开分析等。举个例子来说,就是当你在分析报表时,发现某门店、某产品的生产销售情况异常时,可以立即针对性地分析该门
- 怎么样才能成为专业的程序员?
cocos2d-x小菜
编程PHP
如何要想成为一名专业的程序员?仅仅会写代码是不够的。从团队合作去解决问题到版本控制,你还得具备其他关键技能的工具包。当我们询问相关的专业开发人员,那些必备的关键技能都是什么的时候,下面是我们了解到的情况。
关于如何学习代码,各种声音很多,然后很多人就被误导为成为专业开发人员懂得一门编程语言就够了?!呵呵,就像其他工作一样,光会一个技能那是远远不够的。如果你想要成为
- java web开发 高并发处理
BreakingBad
javaWeb并发开发处理高
java处理高并发高负载类网站中数据库的设计方法(java教程,java处理大量数据,java高负载数据) 一:高并发高负载类网站关注点之数据库 没错,首先是数据库,这是大多数应用所面临的首个SPOF。尤其是Web2.0的应用,数据库的响应是首先要解决的。 一般来说MySQL是最常用的,可能最初是一个mysql主机,当数据增加到100万以上,那么,MySQL的效能急剧下降。常用的优化措施是M-S(
- mysql批量更新
ekian
mysql
mysql更新优化:
一版的更新的话都是采用update set的方式,但是如果需要批量更新的话,只能for循环的执行更新。或者采用executeBatch的方式,执行更新。无论哪种方式,性能都不见得多好。
三千多条的更新,需要3分多钟。
查询了批量更新的优化,有说replace into的方式,即:
replace into tableName(id,status) values
- 微软BI(3)
18289753290
微软BI SSIS
1)
Q:该列违反了完整性约束错误;已获得 OLE DB 记录。源:“Microsoft SQL Server Native Client 11.0” Hresult: 0x80004005 说明:“不能将值 NULL 插入列 'FZCHID',表 'JRB_EnterpriseCredit.dbo.QYFZCH';列不允许有 Null 值。INSERT 失败。”。
A:一般这类问题的存在是
- Java中的List
g21121
java
List是一个有序的 collection(也称为序列)。此接口的用户可以对列表中每个元素的插入位置进行精确地控制。用户可以根据元素的整数索引(在列表中的位置)访问元素,并搜索列表中的元素。
与 set 不同,列表通常允许重复
- 读书笔记
永夜-极光
读书笔记
1. K是一家加工厂,需要采购原材料,有A,B,C,D 4家供应商,其中A给出的价格最低,性价比最高,那么假如你是这家企业的采购经理,你会如何决策?
传统决策: A:100%订单 B,C,D:0%
&nbs
- centos 安装 Codeblocks
随便小屋
codeblocks
1.安装gcc,需要c和c++两部分,默认安装下,CentOS不安装编译器的,在终端输入以下命令即可yum install gccyum install gcc-c++
2.安装gtk2-devel,因为默认已经安装了正式产品需要的支持库,但是没有安装开发所需要的文档.yum install gtk2*
3. 安装wxGTK
yum search w
- 23种设计模式的形象比喻
aijuans
设计模式
1、ABSTRACT FACTORY—追MM少不了请吃饭了,麦当劳的鸡翅和肯德基的鸡翅都是MM爱吃的东西,虽然口味有所不同,但不管你带MM去麦当劳或肯德基,只管向服务员说“来四个鸡翅”就行了。麦当劳和肯德基就是生产鸡翅的Factory 工厂模式:客户类和工厂类分开。消费者任何时候需要某种产品,只需向工厂请求即可。消费者无须修改就可以接纳新产品。缺点是当产品修改时,工厂类也要做相应的修改。如:
- 开发管理 CheckLists
aoyouzi
开发管理 CheckLists
开发管理 CheckLists(23) -使项目组度过完整的生命周期
开发管理 CheckLists(22) -组织项目资源
开发管理 CheckLists(21) -控制项目的范围开发管理 CheckLists(20) -项目利益相关者责任开发管理 CheckLists(19) -选择合适的团队成员开发管理 CheckLists(18) -敏捷开发 Scrum Master 工作开发管理 C
- js实现切换
百合不是茶
JavaScript栏目切换
js主要功能之一就是实现页面的特效,窗体的切换可以减少页面的大小,被门户网站大量应用思路:
1,先将要显示的设置为display:bisible 否则设为none
2,设置栏目的id ,js获取栏目的id,如果id为Null就设置为显示
3,判断js获取的id名字;再设置是否显示
代码实现:
html代码:
<di
- 周鸿祎在360新员工入职培训上的讲话
bijian1013
感悟项目管理人生职场
这篇文章也是最近偶尔看到的,考虑到原博客发布者可能将其删除等原因,也更方便个人查找,特将原文拷贝再发布的。“学东西是为自己的,不要整天以混的姿态来跟公司博弈,就算是混,我觉得你要是能在混的时间里,收获一些别的有利于人生发展的东西,也是不错的,看你怎么把握了”,看了之后,对这句话记忆犹新。 &
- 前端Web开发的页面效果
Bill_chen
htmlWebMicrosoft
1.IE6下png图片的透明显示:
<img src="图片地址" border="0" style="Filter.Alpha(Opacity)=数值(100),style=数值(3)"/>
或在<head></head>间加一段JS代码让透明png图片正常显示。
2.<li>标
- 【JVM五】老年代垃圾回收:并发标记清理GC(CMS GC)
bit1129
垃圾回收
CMS概述
并发标记清理垃圾回收(Concurrent Mark and Sweep GC)算法的主要目标是在GC过程中,减少暂停用户线程的次数以及在不得不暂停用户线程的请夸功能,尽可能短的暂停用户线程的时间。这对于交互式应用,比如web应用来说,是非常重要的。
CMS垃圾回收针对新生代和老年代采用不同的策略。相比同吞吐量垃圾回收,它要复杂的多。吞吐量垃圾回收在执
- Struts2技术总结
白糖_
struts2
必备jar文件
早在struts2.0.*的时候,struts2的必备jar包需要如下几个:
commons-logging-*.jar Apache旗下commons项目的log日志包
freemarker-*.jar
- Jquery easyui layout应用注意事项
bozch
jquery浏览器easyuilayout
在jquery easyui中提供了easyui-layout布局,他的布局比较局限,类似java中GUI的border布局。下面对其使用注意事项作简要介绍:
如果在现有的工程中前台界面均应用了jquery easyui,那么在布局的时候最好应用jquery eaysui的layout布局,否则在表单页面(编辑、查看、添加等等)在不同的浏览器会出
- java-拷贝特殊链表:有一个特殊的链表,其中每个节点不但有指向下一个节点的指针pNext,还有一个指向链表中任意节点的指针pRand,如何拷贝这个特殊链表?
bylijinnan
java
public class CopySpecialLinkedList {
/**
* 题目:有一个特殊的链表,其中每个节点不但有指向下一个节点的指针pNext,还有一个指向链表中任意节点的指针pRand,如何拷贝这个特殊链表?
拷贝pNext指针非常容易,所以题目的难点是如何拷贝pRand指针。
假设原来链表为A1 -> A2 ->... -> An,新拷贝
- color
Chen.H
JavaScripthtmlcss
<!DOCTYPE HTML PUBLIC "-//W3C//DTD HTML 4.01 Transitional//EN" "http://www.w3.org/TR/html4/loose.dtd"> <HTML> <HEAD>&nbs
- [信息与战争]移动通讯与网络
comsci
网络
两个坚持:手机的电池必须可以取下来
光纤不能够入户,只能够到楼宇
建议大家找这本书看看:<&
- oracle flashback query(闪回查询)
daizj
oracleflashback queryflashback table
在Oracle 10g中,Flash back家族分为以下成员:
Flashback Database
Flashback Drop
Flashback Table
Flashback Query(分Flashback Query,Flashback Version Query,Flashback Transaction Query)
下面介绍一下Flashback Drop 和Flas
- zeus持久层DAO单元测试
deng520159
单元测试
zeus代码测试正紧张进行中,但由于工作比较忙,但速度比较慢.现在已经完成读写分离单元测试了,现在把几种情况单元测试的例子发出来,希望有人能进出意见,让它走下去.
本文是zeus的dao单元测试:
1.单元测试直接上代码
package com.dengliang.zeus.webdemo.test;
import org.junit.Test;
import o
- C语言学习三printf函数和scanf函数学习
dcj3sjt126com
cprintfscanflanguage
printf函数
/*
2013年3月10日20:42:32
地点:北京潘家园
功能:
目的:
测试%x %X %#x %#X的用法
*/
# include <stdio.h>
int main(void)
{
printf("哈哈!\n"); // \n表示换行
int i = 10;
printf
- 那你为什么小时候不好好读书?
dcj3sjt126com
life
dady, 我今天捡到了十块钱, 不过我还给那个人了
good girl! 那个人有没有和你讲thank you啊
没有啦....他拉我的耳朵我才把钱还给他的, 他哪里会和我讲thank you
爸爸, 如果地上有一张5块一张10块你拿哪一张呢....
当然是拿十块的咯...
爸爸你很笨的, 你不会两张都拿
爸爸为什么上个月那个人来跟你讨钱, 你告诉他没
- iptables开放端口
Fanyucai
linuxiptables端口
1,找到配置文件
vi /etc/sysconfig/iptables
2,添加端口开放,增加一行,开放18081端口
-A INPUT -m state --state NEW -m tcp -p tcp --dport 18081 -j ACCEPT
3,保存
ESC
:wq!
4,重启服务
service iptables
- Ehcache(05)——缓存的查询
234390216
排序ehcache统计query
缓存的查询
目录
1. 使Cache可查询
1.1 基于Xml配置
1.2 基于代码的配置
2 指定可搜索的属性
2.1 可查询属性类型
2.2 &
- 通过hashset找到数组中重复的元素
jackyrong
hashset
如何在hashset中快速找到重复的元素呢?方法很多,下面是其中一个办法:
int[] array = {1,1,2,3,4,5,6,7,8,8};
Set<Integer> set = new HashSet<Integer>();
for(int i = 0
- 使用ajax和window.history.pushState无刷新改变页面内容和地址栏URL
lanrikey
history
后退时关闭当前页面
<script type="text/javascript">
jQuery(document).ready(function ($) {
if (window.history && window.history.pushState) {
- 应用程序的通信成本
netkiller.github.com
虚拟机应用服务器陈景峰netkillerneo
应用程序的通信成本
什么是通信
一个程序中两个以上功能相互传递信号或数据叫做通信。
什么是成本
这是是指时间成本与空间成本。 时间就是传递数据所花费的时间。空间是指传递过程耗费容量大小。
都有哪些通信方式
全局变量
线程间通信
共享内存
共享文件
管道
Socket
硬件(串口,USB) 等等
全局变量
全局变量是成本最低通信方法,通过设置
- 一维数组与二维数组的声明与定义
恋洁e生
二维数组一维数组定义声明初始化
/** * */ package test20111005; /** * @author FlyingFire * @date:2011-11-18 上午04:33:36 * @author :代码整理 * @introduce :一维数组与二维数组的初始化 *summary: */ public c
- Spring Mybatis独立事务配置
toknowme
mybatis
在项目中有很多地方会使用到独立事务,下面以获取主键为例
(1)修改配置文件spring-mybatis.xml <!-- 开启事务支持 --> <tx:annotation-driven transaction-manager="transactionManager" /> &n
- 更新Anadroid SDK Tooks之后,Eclipse提示No update were found
xp9802
eclipse
使用Android SDK Manager 更新了Anadroid SDK Tooks 之后,
打开eclipse提示 This Android SDK requires Android Developer Toolkit version 23.0.0 or above, 点击Check for Updates
检测一会后提示 No update were found