- QQ群采集助手,精准引流必备神器
2401_87347160
其他经验分享
功能概述微信群查找与筛选工具是一款专为微信用户设计的辅助工具,它通过关键词搜索功能,帮助用户快速找到相关的微信群,并提供筛选是否需要验证的群组的功能。主要功能关键词搜索:用户可以输入关键词,工具将自动查找包含该关键词的微信群。筛选功能:工具提供筛选机制,用户可以选择是否只显示需要验证或不需要验证的群组。精准引流:通过上述功能,用户可以更精准地找到目标群组,进行有效的引流操作。3.设备需求该工具可以
- 微服务下功能权限与数据权限的设计与实现
nbsaas-boot
微服务java架构
在微服务架构下,系统的功能权限和数据权限控制显得尤为重要。随着系统规模的扩大和微服务数量的增加,如何保证不同用户和服务之间的访问权限准确、细粒度地控制,成为设计安全策略的关键。本文将讨论如何在微服务体系中设计和实现功能权限与数据权限控制。1.功能权限与数据权限的定义功能权限:指用户或系统角色对特定功能的访问权限。通常是某个用户角色能否执行某个操作,比如查看订单、创建订单、修改用户资料等。数据权限:
- 理解Gunicorn:Python WSGI服务器的基石
范范0825
ipythonlinux运维
理解Gunicorn:PythonWSGI服务器的基石介绍Gunicorn,全称GreenUnicorn,是一个为PythonWSGI(WebServerGatewayInterface)应用设计的高效、轻量级HTTP服务器。作为PythonWeb应用部署的常用工具,Gunicorn以其高性能和易用性著称。本文将介绍Gunicorn的基本概念、安装和配置,帮助初学者快速上手。1.什么是Gunico
- c++ 的iostream 和 c++的stdio的区别和联系
黄卷青灯77
c++算法开发语言iostreamstdio
在C++中,iostream和C语言的stdio.h都是用于处理输入输出的库,但它们在设计、用法和功能上有许多不同。以下是两者的区别和联系:区别1.编程风格iostream(C++风格):C++标准库中的输入输出流类库,支持面向对象的输入输出操作。典型用法是cin(输入)和cout(输出),使用>操作符来处理数据。更加类型安全,支持用户自定义类型的输入输出。#includeintmain(){in
- Linux下QT开发的动态库界面弹出操作(SDL2)
13jjyao
QT类qt开发语言sdl2linux
需求:操作系统为linux,开发框架为qt,做成需带界面的qt动态库,调用方为java等非qt程序难点:调用方为java等非qt程序,也就是说调用方肯定不带QApplication::exec(),缺少了这个,QTimer等事件和QT创建的窗口将不能弹出(包括opencv也是不能弹出);这与qt调用本身qt库是有本质的区别的思路:1.调用方缺QApplication::exec(),那么我们在接口
- Python数据分析与可视化实战指南
William数据分析
pythonpython数据
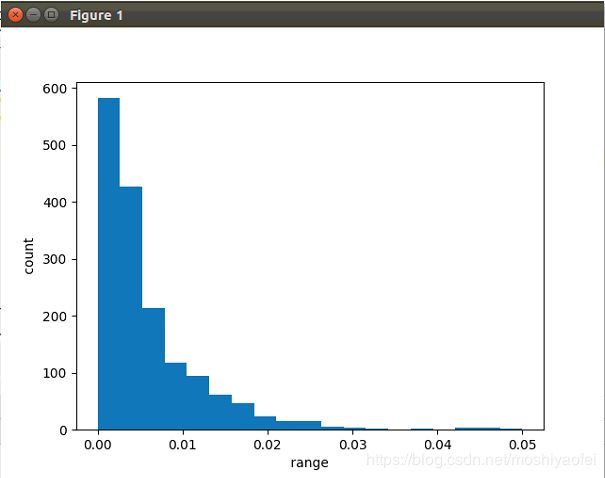
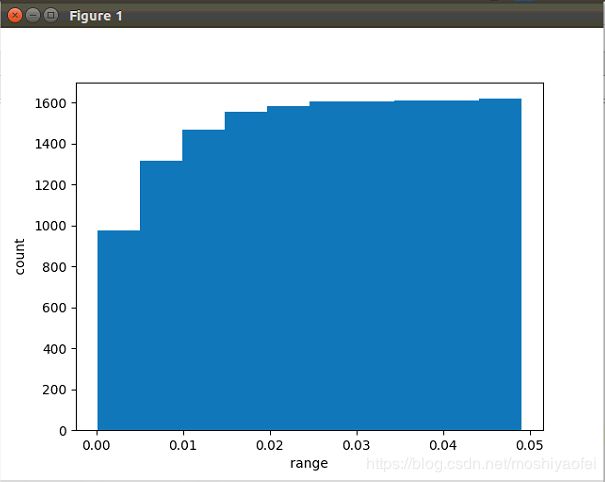
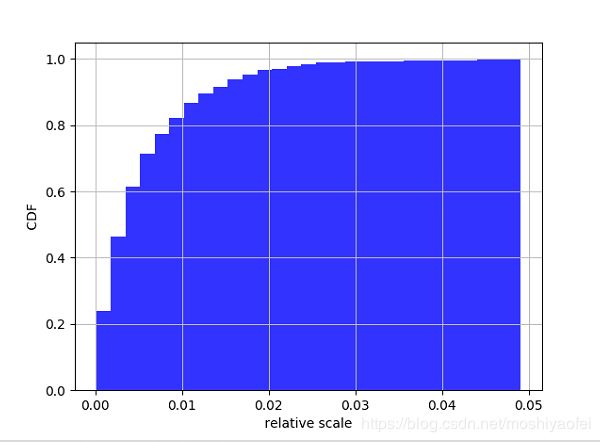
在数据驱动的时代,Python因其简洁的语法、强大的库生态系统以及活跃的社区,成为了数据分析与可视化的首选语言。本文将通过一个详细的案例,带领大家学习如何使用Python进行数据分析,并通过可视化来直观呈现分析结果。一、环境准备1.1安装必要库在开始数据分析和可视化之前,我们需要安装一些常用的库。主要包括pandas、numpy、matplotlib和seaborn等。这些库分别用于数据处理、数学
- git常用命令笔记
咩酱-小羊
git笔记
###用习惯了idea总是不记得git的一些常见命令,需要用到的时候总是担心旁边站了人~~~记个笔记@_@,告诉自己看笔记不丢人初始化初始化一个新的Git仓库gitinit配置配置用户信息gitconfig--globaluser.name"YourName"gitconfig--globaluser.email"
[email protected]"基本操作克隆远程仓库gitclone查看
- python os.environ
江湖偌大
python深度学习
os.environ['TF_CPP_MIN_LOG_LEVEL']='0'#默认值,输出所有信息os.environ['TF_CPP_MIN_LOG_LEVEL']='1'#屏蔽通知信息(INFO)os.environ['TF_CPP_MIN_LOG_LEVEL']='2'#屏蔽通知信息和警告信息(INFO\WARNING)os.environ['TF_CPP_MIN_LOG_LEVEL']='
- Python中os.environ基本介绍及使用方法
鹤冲天Pro
#Pythonpython服务器开发语言
文章目录python中os.environos.environ简介os.environ进行环境变量的增删改查python中os.environ的使用详解1.简介2.key字段详解2.1常见key字段3.os.environ.get()用法4.环境变量的增删改查和判断是否存在4.1新增环境变量4.2更新环境变量4.3获取环境变量4.4删除环境变量4.5判断环境变量是否存在python中os.envi
- Pyecharts数据可视化大屏:打造沉浸式数据分析体验
我的运维人生
信息可视化数据分析数据挖掘运维开发技术共享
Pyecharts数据可视化大屏:打造沉浸式数据分析体验在当今这个数据驱动的时代,如何将海量数据以直观、生动的方式展现出来,成为了数据分析师和企业决策者关注的焦点。Pyecharts,作为一款基于Python的开源数据可视化库,凭借其丰富的图表类型、灵活的配置选项以及高度的定制化能力,成为了构建数据可视化大屏的理想选择。本文将深入探讨如何利用Pyecharts打造数据可视化大屏,并通过实际代码案例
- Python教程:一文了解使用Python处理XPath
旦莫
Python进阶python开发语言
目录1.环境准备1.1安装lxml1.2验证安装2.XPath基础2.1什么是XPath?2.2XPath语法2.3示例XML文档3.使用lxml解析XML3.1解析XML文档3.2查看解析结果4.XPath查询4.1基本路径查询4.2使用属性查询4.3查询多个节点5.XPath的高级用法5.1使用逻辑运算符5.2使用函数6.实战案例6.1从网页抓取数据6.1.1安装Requests库6.1.2代
- python os.environ_python os.environ 读取和设置环境变量
weixin_39605414
pythonos.environ
>>>importos>>>os.environ.keys()['LC_NUMERIC','GOPATH','GOROOT','GOBIN','LESSOPEN','SSH_CLIENT','LOGNAME','USER','HOME','LC_PAPER','PATH','DISPLAY','LANG','TERM','SHELL','J2REDIR','LC_MONETARY','QT_QPA
- 将cmd中命令输出保存为txt文本文件
落难Coder
Windowscmdwindow
最近深度学习本地的训练中我们常常要在命令行中运行自己的代码,无可厚非,我们有必要保存我们的炼丹结果,但是复制命令行输出到txt是非常麻烦的,其实Windows下的命令行为我们提供了相应的操作。其基本的调用格式就是:运行指令>输出到的文件名称或者具体保存路径测试下,我打开cmd并且ping一下百度:pingwww.baidu.com>./data.txt看下相同目录下data.txt的输出:如果你再
- PHP环境搭建详细教程
好看资源平台
前端php
PHP是一个流行的服务器端脚本语言,广泛用于Web开发。为了使PHP能够在本地或服务器上运行,我们需要搭建一个合适的PHP环境。本教程将结合最新资料,介绍在不同操作系统上搭建PHP开发环境的多种方法,包括Windows、macOS和Linux系统的安装步骤,以及本地和Docker环境的配置。1.PHP环境搭建概述PHP环境的搭建主要分为以下几类:集成开发环境:例如XAMPP、WAMP、MAMP,这
- 使用 FinalShell 进行远程连接(ssh 远程连接 Linux 服务器)
编程经验分享
开发工具服务器sshlinux
目录前言基本使用教程新建远程连接连接主机自定义命令路由追踪前言后端开发,必然需要和服务器打交道,部署应用,排查问题,查看运行日志等等。一般服务器都是集中部署在机房中,也有一些直接是云服务器,总而言之,程序员不可能直接和服务器直接操作,一般都是通过ssh连接来登录服务器。刚接触远程连接时,使用的是XSHELL来远程连接服务器,连接上就能够操作远程服务器了,但是仅用XSHELL并没有上传下载文件的功能
- 使用Faiss进行高效相似度搜索
llzwxh888
faisspython
在现代AI应用中,快速和高效的相似度搜索是至关重要的。Faiss(FacebookAISimilaritySearch)是一个专门用于快速相似度搜索和聚类的库,特别适用于高维向量。本文将介绍如何使用Faiss来进行相似度搜索,并结合Python代码演示其基本用法。什么是Faiss?Faiss是一个由FacebookAIResearch团队开发的开源库,主要用于高维向量的相似性搜索和聚类。Faiss
- python是什么意思中文-在python中%是什么意思
编程大乐趣
Python中%有两种:1、数值运算:%代表取模,返回除法的余数。如:>>>7%212、%操作符(字符串格式化,stringformatting),说明如下:%[(name)][flags][width].[precision]typecode(name)为命名flags可以有+,-,''或0。+表示右对齐。-表示左对齐。''为一个空格,表示在正数的左侧填充一个空格,从而与负数对齐。0表示使用0填
- 关于城市旅游的HTML网页设计——(旅游风景云南 5页)HTML+CSS+JavaScript
二挡起步
web前端期末大作业javascripthtmlcss旅游风景
⛵源码获取文末联系✈Web前端开发技术描述网页设计题材,DIV+CSS布局制作,HTML+CSS网页设计期末课程大作业|游景点介绍|旅游风景区|家乡介绍|等网站的设计与制作|HTML期末大学生网页设计作业,Web大学生网页HTML:结构CSS:样式在操作方面上运用了html5和css3,采用了div+css结构、表单、超链接、浮动、绝对定位、相对定位、字体样式、引用视频等基础知识JavaScrip
- HTML网页设计制作大作业(div+css) 云南我的家乡旅游景点 带文字滚动
二挡起步
web前端期末大作业web设计网页规划与设计htmlcssjavascriptdreamweaver前端
Web前端开发技术描述网页设计题材,DIV+CSS布局制作,HTML+CSS网页设计期末课程大作业游景点介绍|旅游风景区|家乡介绍|等网站的设计与制作HTML期末大学生网页设计作业HTML:结构CSS:样式在操作方面上运用了html5和css3,采用了div+css结构、表单、超链接、浮动、绝对定位、相对定位、字体样式、引用视频等基础知识JavaScript:做与用户的交互行为文章目录前端学习路线
- Day1笔记-Python简介&标识符和关键字&输入输出
~在杰难逃~
Pythonpython开发语言大数据数据分析数据挖掘
大家好,从今天开始呢,杰哥开展一个新的专栏,当然,数据分析部分也会不定时更新的,这个新的专栏主要是讲解一些Python的基础语法和知识,帮助0基础的小伙伴入门和学习Python,感兴趣的小伙伴可以开始认真学习啦!一、Python简介【了解】1.计算机工作原理编程语言就是用来定义计算机程序的形式语言。我们通过编程语言来编写程序代码,再通过语言处理程序执行向计算机发送指令,让计算机完成对应的工作,编程
- python八股文面试题分享及解析(1)
Shawn________
python
#1.'''a=1b=2不用中间变量交换a和b'''#1.a=1b=2a,b=b,aprint(a)print(b)结果:21#2.ll=[]foriinrange(3):ll.append({'num':i})print(11)结果:#[{'num':0},{'num':1},{'num':2}]#3.kk=[]a={'num':0}foriinrange(3):#0,12#可变类型,不仅仅改变
- 每日算法&面试题,大厂特训二十八天——第二十天(树)
肥学
⚡算法题⚡面试题每日精进java算法数据结构
目录标题导读算法特训二十八天面试题点击直接资料领取导读肥友们为了更好的去帮助新同学适应算法和面试题,最近我们开始进行专项突击一步一步来。上一期我们完成了动态规划二十一天现在我们进行下一项对各类算法进行二十八天的一个小总结。还在等什么快来一起肥学进行二十八天挑战吧!!特别介绍小白练手专栏,适合刚入手的新人欢迎订阅编程小白进阶python有趣练手项目里面包括了像《机器人尬聊》《恶搞程序》这样的有趣文章
- Python快速入门 —— 第三节:类与对象
孤华暗香
Python快速入门python开发语言
第三节:类与对象目标:了解面向对象编程的基础概念,并学会如何定义类和创建对象。内容:类与对象:定义类:class关键字。类的构造函数:__init__()。类的属性和方法。对象的创建与使用。示例:classStudent:def__init__(self,name,age,major):self.name&#
- MongoDB Oplog 窗口
喝醉酒的小白
MongoDB运维
在MongoDB中,oplog(操作日志)是一个特殊的日志系统,用于记录对数据库的所有写操作。oplog允许副本集成员(通常是从节点)应用主节点上已经执行的操作,从而保持数据的一致性。它是MongoDB副本集实现数据复制的基础。MongoDBOplog窗口oplog窗口是指在MongoDB副本集中,从节点可以用来同步数据的时间范围。这个窗口通常由以下因素决定:Oplog大小:oplog的大小是有限
- pyecharts——绘制柱形图折线图
2224070247
信息可视化pythonjava数据可视化
一、pyecharts概述自2013年6月百度EFE(ExcellentFrontEnd)数据可视化团队研发的ECharts1.0发布到GitHub网站以来,ECharts一直备受业界权威的关注并获得广泛好评,成为目前成熟且流行的数据可视化图表工具,被应用到诸多数据可视化的开发领域。Python作为数据分析领域最受欢迎的语言,也加入ECharts的使用行列,并研发出方便Python开发者使用的数据
- Python 实现图片裁剪(附代码) | Python工具
剑客阿良_ALiang
前言本文提供将图片按照自定义尺寸进行裁剪的工具方法,一如既往的实用主义。环境依赖ffmpeg环境安装,可以参考我的另一篇文章:windowsffmpeg安装部署_阿良的博客-CSDN博客本文主要使用到的不是ffmpeg,而是ffprobe也在上面这篇文章中的zip包中。ffmpy安装:pipinstallffmpy-ihttps://pypi.douban.com/simple代码不废话了,上代码
- 【华为OD技术面试真题 - 技术面】- python八股文真题题库(4)
算法大师
华为od面试python
华为OD面试真题精选专栏:华为OD面试真题精选目录:2024华为OD面试手撕代码真题目录以及八股文真题目录文章目录华为OD面试真题精选**1.Python中的`with`**用途和功能自动资源管理示例:文件操作上下文管理协议示例代码工作流程解析优点2.\_\_new\_\_和**\_\_init\_\_**区别__new____init__区别总结3.**切片(Slicing)操作**基本切片语法
- python os 环境变量
CV矿工
python开发语言numpy
环境变量:环境变量是程序和操作系统之间的通信方式。有些字符不宜明文写进代码里,比如数据库密码,个人账户密码,如果写进自己本机的环境变量里,程序用的时候通过os.environ.get()取出来就行了。os.environ是一个环境变量的字典。环境变量的相关操作importos"""设置/修改环境变量:os.environ[‘环境变量名称’]=‘环境变量值’#其中key和value均为string类
- Python爬虫解析工具之xpath使用详解
eqa11
python爬虫开发语言
文章目录Python爬虫解析工具之xpath使用详解一、引言二、环境准备1、插件安装2、依赖库安装三、xpath语法详解1、路径表达式2、通配符3、谓语4、常用函数四、xpath在Python代码中的使用1、文档树的创建2、使用xpath表达式3、获取元素内容和属性五、总结Python爬虫解析工具之xpath使用详解一、引言在Python爬虫开发中,数据提取是一个至关重要的环节。xpath作为一门
- 【PG】常见数据库、表属性设置
江无羡
数据库
PG的常见属性配置方法数据库复制、备份相关表的复制标识单表操作批量表操作链接数据库复制、备份相关表的复制标识单表操作通过ALTER语句单独更改一张表的复制标识。ALTERTABLE[tablename]REPLICAIDENTITYFULL;批量表操作通过代码块的方式,对某个schema中的所有表一起更新其复制标识。SELECTtablename,CASErelreplidentWHEN'd'TH
- Maven
Array_06
eclipsejdkmaven
Maven
Maven是基于项目对象模型(POM), 信息来管理项目的构建,报告和文档的软件项目管理工具。
Maven 除了以程序构建能力为特色之外,还提供高级项目管理工具。由于 Maven 的缺省构建规则有较高的可重用性,所以常常用两三行 Maven 构建脚本就可以构建简单的项目。由于 Maven 的面向项目的方法,许多 Apache Jakarta 项目发文时使用 Maven,而且公司
- ibatis的queyrForList和queryForMap区别
bijian1013
javaibatis
一.说明
iBatis的返回值参数类型也有种:resultMap与resultClass,这两种类型的选择可以用两句话说明之:
1.当结果集列名和类的属性名完全相对应的时候,则可直接用resultClass直接指定查询结果类
- LeetCode[位运算] - #191 计算汉明权重
Cwind
java位运算LeetCodeAlgorithm题解
原题链接:#191 Number of 1 Bits
要求:
写一个函数,以一个无符号整数为参数,返回其汉明权重。例如,‘11’的二进制表示为'00000000000000000000000000001011', 故函数应当返回3。
汉明权重:指一个字符串中非零字符的个数;对于二进制串,即其中‘1’的个数。
难度:简单
分析:
将十进制参数转换为二进制,然后计算其中1的个数即可。
“
- 浅谈java类与对象
15700786134
java
java是一门面向对象的编程语言,类与对象是其最基本的概念。所谓对象,就是一个个具体的物体,一个人,一台电脑,都是对象。而类,就是对象的一种抽象,是多个对象具有的共性的一种集合,其中包含了属性与方法,就是属于该类的对象所具有的共性。当一个类创建了对象,这个对象就拥有了该类全部的属性,方法。相比于结构化的编程思路,面向对象更适用于人的思维
- linux下双网卡同一个IP
被触发
linux
转自:
http://q2482696735.blog.163.com/blog/static/250606077201569029441/
由于需要一台机器有两个网卡,开始时设置在同一个网段的IP,发现数据总是从一个网卡发出,而另一个网卡上没有数据流动。网上找了下,发现相同的问题不少:
一、
关于双网卡设置同一网段IP然后连接交换机的时候出现的奇怪现象。当时没有怎么思考、以为是生成树
- 安卓按主页键隐藏程序之后无法再次打开
肆无忌惮_
安卓
遇到一个奇怪的问题,当SplashActivity跳转到MainActivity之后,按主页键,再去打开程序,程序没法再打开(闪一下),结束任务再开也是这样,只能卸载了再重装。而且每次在Log里都打印了这句话"进入主程序"。后来发现是必须跳转之后再finish掉SplashActivity
本来代码:
// 销毁这个Activity
fin
- 通过cookie保存并读取用户登录信息实例
知了ing
JavaScripthtml
通过cookie的getCookies()方法可获取所有cookie对象的集合;通过getName()方法可以获取指定的名称的cookie;通过getValue()方法获取到cookie对象的值。另外,将一个cookie对象发送到客户端,使用response对象的addCookie()方法。
下面通过cookie保存并读取用户登录信息的例子加深一下理解。
(1)创建index.jsp文件。在改
- JAVA 对象池
矮蛋蛋
javaObjectPool
原文地址:
http://www.blogjava.net/baoyaer/articles/218460.html
Jakarta对象池
☆为什么使用对象池
恰当地使用对象池化技术,可以有效地减少对象生成和初始化时的消耗,提高系统的运行效率。Jakarta Commons Pool组件提供了一整套用于实现对象池化
- ArrayList根据条件+for循环批量删除的方法
alleni123
java
场景如下:
ArrayList<Obj> list
Obj-> createTime, sid.
现在要根据obj的createTime来进行定期清理。(释放内存)
-------------------------
首先想到的方法就是
for(Obj o:list){
if(o.createTime-currentT>xxx){
- 阿里巴巴“耕地宝”大战各种宝
百合不是茶
平台战略
“耕地保”平台是阿里巴巴和安徽农民共同推出的一个 “首个互联网定制私人农场”,“耕地宝”由阿里巴巴投入一亿 ,主要是用来进行农业方面,将农民手中的散地集中起来 不仅加大农民集体在土地上面的话语权,还增加了土地的流通与 利用率,提高了土地的产量,有利于大规模的产业化的高科技农业的 发展,阿里在农业上的探索将会引起新一轮的产业调整,但是集体化之后农民的个体的话语权 将更少,国家应出台相应的法律法规保护
- Spring注入有继承关系的类(1)
bijian1013
javaspring
一个类一个类的注入
1.AClass类
package com.bijian.spring.test2;
public class AClass {
String a;
String b;
public String getA() {
return a;
}
public void setA(Strin
- 30岁转型期你能否成为成功人士
bijian1013
成功
很多人由于年轻时走了弯路,到了30岁一事无成,这样的例子大有人在。但同样也有一些人,整个职业生涯都发展得很优秀,到了30岁已经成为职场的精英阶层。由于做猎头的原因,我们接触很多30岁左右的经理人,发现他们在职业发展道路上往往有很多致命的问题。在30岁之前,他们的职业生涯表现很优秀,但从30岁到40岁这一段,很多人
- [Velocity三]基于Servlet+Velocity的web应用
bit1129
velocity
什么是VelocityViewServlet
使用org.apache.velocity.tools.view.VelocityViewServlet可以将Velocity集成到基于Servlet的web应用中,以Servlet+Velocity的方式实现web应用
Servlet + Velocity的一般步骤
1.自定义Servlet,实现VelocityViewServl
- 【Kafka十二】关于Kafka是一个Commit Log Service
bit1129
service
Kafka is a distributed, partitioned, replicated commit log service.这里的commit log如何理解?
A message is considered "committed" when all in sync replicas for that partition have applied i
- NGINX + LUA实现复杂的控制
ronin47
lua nginx 控制
安装lua_nginx_module 模块
lua_nginx_module 可以一步步的安装,也可以直接用淘宝的OpenResty
Centos和debian的安装就简单了。。
这里说下freebsd的安装:
fetch http://www.lua.org/ftp/lua-5.1.4.tar.gz
tar zxvf lua-5.1.4.tar.gz
cd lua-5.1.4
ma
- java-14.输入一个已经按升序排序过的数组和一个数字, 在数组中查找两个数,使得它们的和正好是输入的那个数字
bylijinnan
java
public class TwoElementEqualSum {
/**
* 第 14 题:
题目:输入一个已经按升序排序过的数组和一个数字,
在数组中查找两个数,使得它们的和正好是输入的那个数字。
要求时间复杂度是 O(n) 。如果有多对数字的和等于输入的数字,输出任意一对即可。
例如输入数组 1 、 2 、 4 、 7 、 11 、 15 和数字 15 。由于
- Netty源码学习-HttpChunkAggregator-HttpRequestEncoder-HttpResponseDecoder
bylijinnan
javanetty
今天看Netty如何实现一个Http Server
org.jboss.netty.example.http.file.HttpStaticFileServerPipelineFactory:
pipeline.addLast("decoder", new HttpRequestDecoder());
pipeline.addLast(&quo
- java敏感词过虑-基于多叉树原理
cngolon
违禁词过虑替换违禁词敏感词过虑多叉树
基于多叉树的敏感词、关键词过滤的工具包,用于java中的敏感词过滤
1、工具包自带敏感词词库,第一次调用时读入词库,故第一次调用时间可能较长,在类加载后普通pc机上html过滤5000字在80毫秒左右,纯文本35毫秒左右。
2、如需自定义词库,将jar包考入WEB-INF工程的lib目录,在WEB-INF/classes目录下建一个
utf-8的words.dict文本文件,
- 多线程知识
cuishikuan
多线程
T1,T2,T3三个线程工作顺序,按照T1,T2,T3依次进行
public class T1 implements Runnable{
@Override
- spring整合activemq
dalan_123
java spring jms
整合spring和activemq需要搞清楚如下的东东1、ConnectionFactory分: a、spring管理连接到activemq服务器的管理ConnectionFactory也即是所谓产生到jms服务器的链接 b、真正产生到JMS服务器链接的ConnectionFactory还得
- MySQL时间字段究竟使用INT还是DateTime?
dcj3sjt126com
mysql
环境:Windows XPPHP Version 5.2.9MySQL Server 5.1
第一步、创建一个表date_test(非定长、int时间)
CREATE TABLE `test`.`date_test` (`id` INT NOT NULL AUTO_INCREMENT ,`start_time` INT NOT NULL ,`some_content`
- Parcel: unable to marshal value
dcj3sjt126com
marshal
在两个activity直接传递List<xxInfo>时,出现Parcel: unable to marshal value异常。 在MainActivity页面(MainActivity页面向NextActivity页面传递一个List<xxInfo>): Intent intent = new Intent(this, Next
- linux进程的查看上(ps)
eksliang
linux pslinux ps -llinux ps aux
ps:将某个时间点的进程运行情况选取下来
转载请出自出处:http://eksliang.iteye.com/admin/blogs/2119469
http://eksliang.iteye.com
ps 这个命令的man page 不是很好查阅,因为很多不同的Unix都使用这儿ps来查阅进程的状态,为了要符合不同版本的需求,所以这个
- 为什么第三方应用能早于System的app启动
gqdy365
System
Android应用的启动顺序网上有一大堆资料可以查阅了,这里就不细述了,这里不阐述ROM启动还有bootloader,软件启动的大致流程应该是启动kernel -> 运行servicemanager 把一些native的服务用命令启动起来(包括wifi, power, rild, surfaceflinger, mediaserver等等)-> 启动Dalivk中的第一个进程Zygot
- App Framework发送JSONP请求(3)
hw1287789687
jsonp跨域请求发送jsonpajax请求越狱请求
App Framework 中如何发送JSONP请求呢?
使用jsonp,详情请参考:http://json-p.org/
如何发送Ajax请求呢?
(1)登录
/***
* 会员登录
* @param username
* @param password
*/
var user_login=function(username,password){
// aler
- 发福利,整理了一份关于“资源汇总”的汇总
justjavac
资源
觉得有用的话,可以去github关注:https://github.com/justjavac/awesome-awesomeness-zh_CN 通用
free-programming-books-zh_CN 免费的计算机编程类中文书籍
精彩博客集合 hacke2/hacke2.github.io#2
ResumeSample 程序员简历
- 用 Java 技术创建 RESTful Web 服务
macroli
java编程WebREST
转载:http://www.ibm.com/developerworks/cn/web/wa-jaxrs/
JAX-RS (JSR-311) 【 Java API for RESTful Web Services 】是一种 Java™ API,可使 Java Restful 服务的开发变得迅速而轻松。这个 API 提供了一种基于注释的模型来描述分布式资源。注释被用来提供资源的位
- CentOS6.5-x86_64位下oracle11g的安装详细步骤及注意事项
超声波
oraclelinux
前言:
这两天项目要上线了,由我负责往服务器部署整个项目,因此首先要往服务器安装oracle,服务器本身是CentOS6.5的64位系统,安装的数据库版本是11g,在整个的安装过程中碰到很多的坑,不过最后还是通过各种途径解决并成功装上了。转别写篇博客来记录完整的安装过程以及在整个过程中的注意事项。希望对以后那些刚刚接触的菜鸟们能起到一定的帮助作用。
安装过程中可能遇到的问题(注
- HttpClient 4.3 设置keeplive 和 timeout 的方法
supben
httpclient
ConnectionKeepAliveStrategy kaStrategy = new DefaultConnectionKeepAliveStrategy() {
@Override
public long getKeepAliveDuration(HttpResponse response, HttpContext context) {
long keepAlive
- Spring 4.2新特性-@Import注解的升级
wiselyman
spring 4
3.1 @Import
@Import注解在4.2之前只支持导入配置类
在4.2,@Import注解支持导入普通的java类,并将其声明成一个bean
3.2 示例
演示java类
package com.wisely.spring4_2.imp;
public class DemoService {
public void doSomethin