python数据可视化之Seaborn(七|终):FacetGrid与PairGrid操作
写在开头:今天分享的是关于FacetGrid与PairGrid绘制多结构绘图的内容,同样参考文献放置在本章的最后,这也是本系列的最后一节希望自己继续加油。
前文回顾:
第一节分享了Seaborn绘图的整体颜色与风格比例调控,可点击链接查看。
python数据可视化之Seaborn(一)
第二节分享了连续、分类、离散数据的绘图颜色的方法,可点击链接查看。
python数据可视化之Seaborn(二)
第三节分享了对于数据分布的绘图方法,可点击链接查看。
python数据可视化之Seaborn(三)
第四节分享了关于数据相关性的一些绘图展示,可点击链接查看。
python数据可视化之Seaborn(四)
第五节分享了关于分类数据的一些绘图展示方法,可点击链接查看。
python数据可视化之Seaborn(五)
第六节分享了关于回归如何进行绘图的一些方法,可点击链接查看。
python数据可视化之Seaborn(六)
Seaborn可视化内容安排
在Seaborn的学习中安排如下,
一、画风设置:会简单介绍一下绘图风格(一)与颜色风格(二)的设置;
二、绘图技巧:这里会介绍数据集(三)、相关数据(四)、分类数据(五)、线性关系(六)可视化的相关内容;
三、结构网络:本节主要介绍数据识别结构网络的绘图(七)。
三、Seaborn结构网络
在我们通常画图的时候,希望能够将图进行多图结合对比,这样能够将数据的信息最大程度的展现出来,特别对于多维数据的时候这样构建一个结构网络进行绘图就显得尤为重要,下面我们首先加载今天需要的包,
import seaborn as sns
import matplotlib.pyplot as plt
sns.set_style("whitegrid")
快速分格绘图
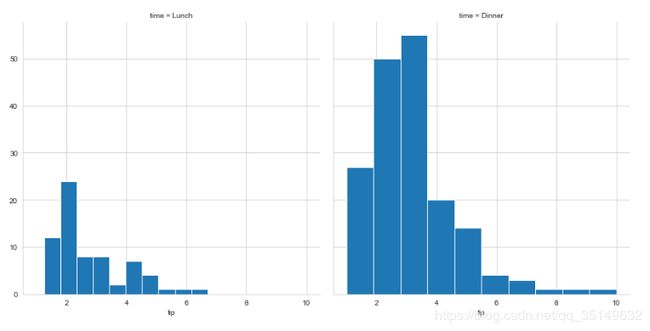
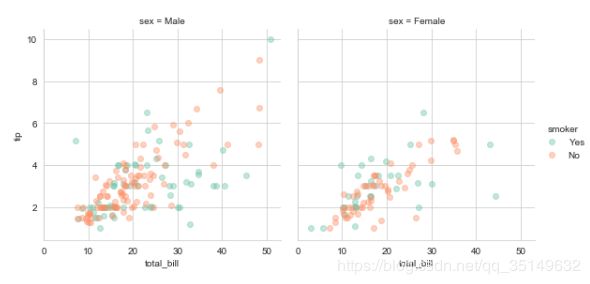
在我们希望绘制一个多类别数据可视化的时候,FacetGrid十分有用,他能够通过row、col、hue三个参数快速实现图像的分隔,在这里我们的绘图代码思路是,先用sns.FacetGrid进行参数的调整,然后使用map的功能,直接绘制图像,
tips = sns.load_dataset("tips")
g = sns.FacetGrid(tips, col="time", size=6)
g.map(plt.hist, "tip");
g = sns.FacetGrid(tips, col="sex", hue="smoker", palette="Set2", size=4)
g.map(plt.scatter, "total_bill", "tip", alpha=.4)
g.add_legend()
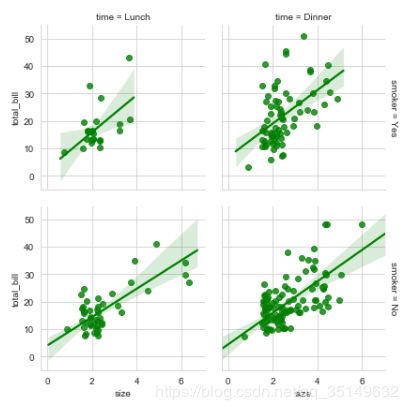
g = sns.FacetGrid(tips, row="smoker", col="time", margin_titles=True)
g.map(sns.regplot, "size", "total_bill", color="g", fit_reg=True, x_jitter=.5)
对于margin_title这个参数并不能和matplotilb很好的对接,尤其是在外绘制类别标签的时候。控制画布大小的主要是height和aspect参数,
g = sns.FacetGrid(tips, col="day", height=4, aspect=.7)
g.map(sns.barplot, "sex", "total_bill")

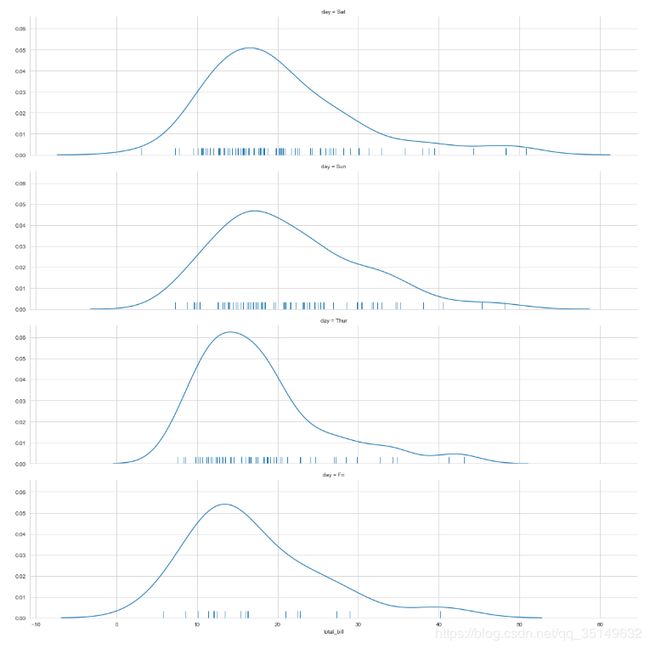
我们在绘制网络格子图的时候还可以设置order参数来调整位置,
order = tips.day.value_counts().index
g = sns.FacetGrid(tips, row="day", row_order=order,
                 height=1.7, aspect=4, size=4)
g.map(sns.distplot, "total_bill", hist=False, rug=True)
当然还可以通过设置字典来对palette调色板来调整颜色,不光能够调节颜色还能够调节标记点形状,利用FacetGrid这种方法绘图的话不能够在map后使用基于FacetGrid的绘图方法,比如lmplot、relplot、catplot等
pal = dict(Lunch="red", Dinner="gray")
g = sns.FacetGrid(tips, hue="time", palette=pal, height=5, hue_kws={"marker":["^", "v"]})
g.map(plt.scatter, "total_bill", "tip", s=100, alpha=.7, linewidth=.5, edgecolor="white")
g.add_legend()

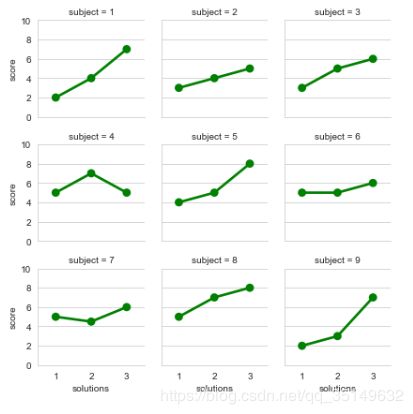
然后还可以用col_wrap参数以及ylim参数来调整绘图布局已经纵坐标的取值范围,
attend = sns.load_dataset("attention").query("subject <= 9")
g = sns.FacetGrid(attend, col="subject", col_wrap=3, height=2, ylim=(0, 10))
g.map(sns.pointplot, "solutions", "score", order=[1, 2, 3], color="g", ci=None)
当我们开始使用FacetGrid进行绘图的时候,我们会想要去对绘图进行许多调整,这个时候我们可以使用FacetGrid.set()的一些方法,来对细节进行调整,在此之前我们是否发现图像很大,但周围的标题等字都很小,为了解决这个问题我们可以设置sns.set(font_scale=2)来调节大小,
sns.set(font_scale=2)#调节文中字体的大小
with sns.axes_style("white"):
    g = sns.FacetGrid(tips, row="sex", col="smoker", margin_titles=True, height=2.5,size=5)
g.map(plt.scatter, "total_bill", "tip", color="#ffcfdc", edgecolor="white", lw=.5, s=50)
g.set_axis_labels("Toal bill", "Tip")
g.set(xticks=[10, 30, 50], yticks=[2, 6, 10])
g.fig.subplots_adjust(wspace=.02, hspace=.02)#四个图之间的间隔调整

在私人订制化的图像中我们可以直接在matplotlib的Figure和Axes中进行设置,会被fig和axes保存为二元数组,另外可以直接使用ax对轴进行控制,
sns.set(font_scale=2)
g = sns.FacetGrid(tips, col="smoker", margin_titles=True, height=4, size=10)
g.map(plt.scatter, "total_bill", "tip", color="#fac205", edgecolor="white", s=200, lw=1)
for ax in g.axes.flat:#这里的g.axes.flat意思大概就是对于该图像吧,这里没太搜到
    ax.plot((0, 50), (0, 10), c=".2", ls="--") #添加斜线
g.set(xlim=(0,50), ylim=(0, 10))

使用自定义函数
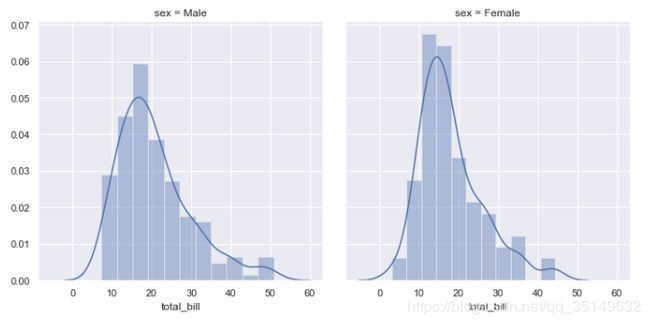
当然我们有时候使用不满足于FacetGrid,我们可以来自定义一些绘图的函数来更友好的绘图,但是在绘图之前我们需要遵守一些小规则,1.要能够调用matplotlib函数的绘图;2.要能够接受数据;3.要能够接受颜色以及标签;
sns.set()
def hist_plot(x, **kwargs):
    sns.distplot(x, **kwargs)

g = sns.FacetGrid(tips, col="sex", height=4, size=5)
g.map(hist_plot, "total_bill")
我们再来绘制一个QQ图,也就是用来绘制数据正态性的图,并调整其中的部分参数,
from scipy import stats
def qqplot(x, y, **kwargs):
    _, xr = stats.probplot(x, fit=False)
    _, yr = stats.probplot(y, fit=False)
    plt.scatter(xr, yr, **kwargs)

g = sns.FacetGrid(tips, hue="time", col="sex", height=4,
                  hue_kws={"marker": ["s", "D"]})
g.map(qqplot, "total_bill", "tip", s=40, edgecolor="w")
g.add_legend();
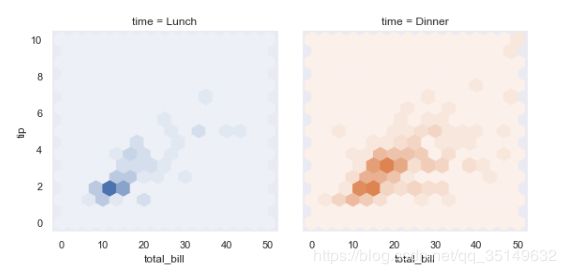
def hexbin(x, y, color, **kwargs):
    cmap = sns.light_palette(color, as_cmap=True)
    plt.hexbin(x, y, gridsize=15, cmap=cmap, **kwargs)

with sns.axes_style("dark"):
    g = sns.FacetGrid(tips, hue="time", col="time", height=4)
g.map(hexbin, "total_bill", "tip",extent=[0, 50, 0, 10])
绘制成对相关图
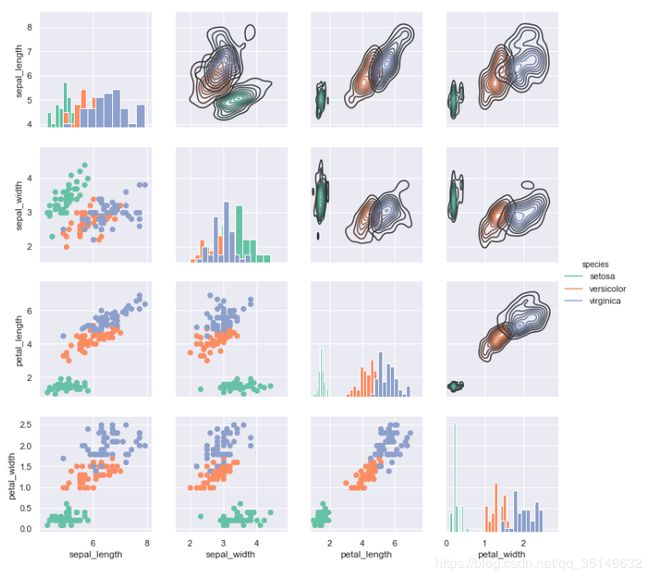
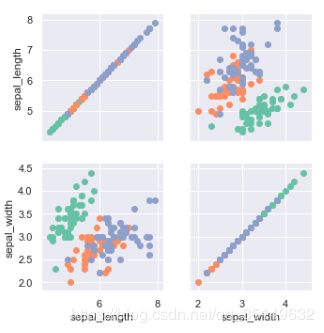
在此之前的相关数据中我们介绍了部分相关的绘图方法,比如PairGrid(),下面我们分享一下,PairGrid()如何调整参数绘制图像,可以设置对象线上画什么还有其他地方画什么,甚至还可以对矩阵图的上三角矩阵绘制一种类型、下三角矩阵绘制一种类型,
iris = sns.load_dataset("iris")
g = sns.PairGrid(iris, hue="species", palette="Set2")
g.map_diag(plt.hist)
g.map_lower(plt.scatter)
g.map_upper(sns.kdeplot)
g.add_legend()
g = sns.PairGrid(iris, vars=["sepal_length", "sepal_width"], hue="species", palette="Set2")
g.map(plt.scatter)
g = sns.PairGrid(tips, y_vars=["total_bill"], x_vars=["tip", "size"], height=4)
g.map(sns.regplot, color="#d6b4fc")
g.set(ylim=(-1, 100), yticks=[0, 100, 10]);
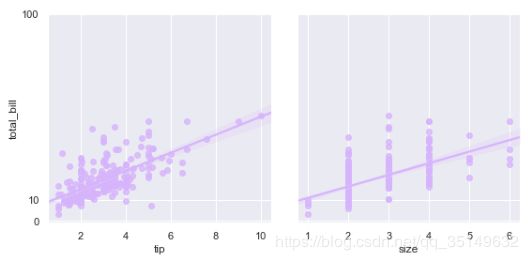
当然pairplot的绘图可以不再PairGrid的提前设置下进行,也可以使用sns.pairplot()函数进行绘制,
sns.set_style("whitegrid")
g = sns.pairplot(iris, hue="species", palette="Set1", diag_kind="kde", height=3)

结语
到此对于Seaborn的绘图的介绍就到此结束,我们对seaborn从颜色、风格到各种绘图、到最后的FacetGrid和PairGrid参数调整进行了全面的了解,当然要熟练使用这些东西还需要在日后的联系中反复回忆才能为自己所用。
谢谢阅读。
参考
Seaborn绘图文档
