python读取TXT文件中数据并根据数据绘制一个或多个线形图,Python求list的最大最小值、平均值,方差(一)
Python读取TXT文件中的数据并绘图
首先创建py项目,将要读取的TXT文件放在项目文件夹下,方便读取;
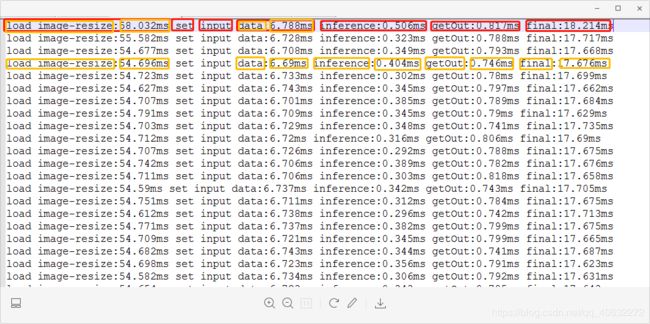
以下是我要读取数据并绘图的TXT文件,命名为time_cal.txt

主要提取的数据分为imageresize, data, inference, getOut, final 五项
下面读取图片并提取每一项的数据
filename = 'time_cal.txt'
#创建一个列表将数据存入各个列表中,step代表读取的行数,后面用作线性图的x坐标
step, imageresize, data, inference, getOut, final = [], [], [], [], [], []
#打开TXT文件并读取
with open(filename, 'r') as f:
    # 将txt中的数据逐行存到列表lines
    lines = f.readlines()
    # j用于判断读了多少条,step为画图的X轴
    j = 0
    for line in lines:
        temp = line.split(' ')#将每一行字符串按照空格分开,存放在temp中,如图
        t1 = temp[1].split(':')#temp[1]为image-resize,读取image-resize的耗时,即用:号分开存入t1中
        t2 = temp[4].split(':')#temp[4]为data,具体操作同上,分析图如下
        t3 = temp[5].split(':')#temp[5]为 inference,具体操作同上,分析图如下
        t4 = temp[6].split(':')#temp[6]为 getOut
        t5 = temp[7].split(':')#temp[7]为final
        step.append(j)#行数
        j = j + 1
        #将获取到的数据去掉单位ms,按float格式存入各个列表中
        imageresize.append(float(t1[1].strip('ms')))
        data.append(float(t2[1].strip('ms')))
        inference.append(float(t3[1].strip('ms')))
        getOut.append(float(t4[1].strip('ms')))
        final.append(float(t5[1].strip('ms\n')))
红色是存放在temp里的字符串

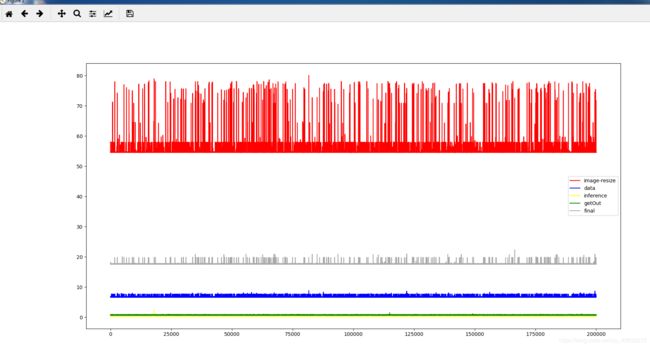
下面进行将五种数据绘制一张线性图,用matplotlib库,参考简书https://www.jianshu.com/p/24b02925847c
代码如下
from matplotlib import pyplot as plt
plt.figure()
plt.plot(step, imageresize, 'red', label='image-resize')
plt.plot(step, data, 'blue', label='data')
plt.plot(step, inference, 'yellow', label='inference')
plt.plot(step, getOut, 'green', label='getOut')
plt.plot(step, final, 'darkgray', label='final')
plt.legend()
plt.show()
from matplotlib import pyplot as plt
import numpy as np
filename = 'time_cal.txt'
step, imageresize, data, inference, getOut, final = [], [], [], [], [], []
# 相比open(),with open()不用手动调用close()方法
with open(filename, 'r') as f:
    # 将txt中的数据逐行存到列表lines里 lines的每一个元素对应于txt中的一行。然后将每个元素中的不同信息提取出来
    lines = f.readlines()
    # i变量,由于这个txt存储时有空行,所以增只读偶数行,主要看txt文件的格式,一般不需要
    # j用于判断读了多少条,step为画图的X轴
    i = 0
    j = 0
    for line in lines:
        temp = line.split(' ')
        t1 = temp[1].split(':')
        t2 = temp[4].split(':')
        t3 = temp[5].split(':')
        t4 = temp[6].split(':')
        t5 = temp[7].split(':')

        step.append(j)
        j = j + 1
        imageresize.append(float(t1[1].strip('ms')))
        data.append(float(t2[1].strip('ms')))
        inference.append(float(t3[1].strip('ms')))
        getOut.append(float(t4[1].strip('ms')))
        final.append(float(t5[1].strip('ms\n')))
#绘制在一张表格
plt.figure()
plt.plot(step, imageresize, 'red', label='image-resize')
plt.plot(step, data, 'blue', label='data')
plt.plot(step, inference, 'yellow', label='inference')
plt.plot(step, getOut, 'green', label='getOut')
plt.plot(step, final, 'darkgray', label='final')
plt.legend()
plt.show()
下一节介绍如何将这些数据分开绘制到多个线性表中,并计算出各项的最大值、最小值、平均值、方差以及标准差
参考博客:https://blog.csdn.net/qq_35077107/article/details/97619685
