Python 数据分析画图
Python 数据分析画图&one-hot编码
标签(空格分隔): python
Matplotlib画图
fig, axes = plt.subplots(2, 2) #axes是一个数组
fig = plt.figure()
fig.set(alpha=0.2)

#把图分为2行3列,当前在(0,0)位置画图
plt.subplot2grid((2, 3), (0, 0))

#data_train是DataFrame数据类型 bar表示柱形图
data_train.Survived.value_counts().plot(kind='bar')

plt.plot(randn(30).cumsum(), 'ko--') #k表示颜色,o表示标记强调数据点,--表示线条类型
plt.plot(randn(30).cumsum(), color='k', linestyle='dashed', marker='o') #和上面等价
设置轴标签 刻度
- xlim控制图标的范围,plt.xlim()返回当前X轴范围,plt.xlim([0, 10]).我们也可以用过subplot的实例ax,如ax.get_xlim和ax.set_xlim来获取设置
- set_xticks控制刻度位置
- set_xticklabels控制刻度上面的标签
实例
fig = plt.figure()
ax = fig.add_subplot(2, 2, 1)
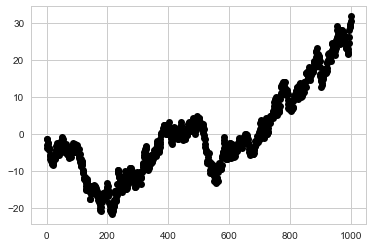
ax.plot(np.random.randn(1000).cumsum(), 'ko--')
ticks = ax.set_xticks([0, 250, 500, 750, 1000])
labels = ax.set_xticklabels(['one', 'two', 'three', 'four', 'five'], rotation=3, fontsize='small')
ax.set_title('My Title')
ax.set_xlabel('xlabel')
添加图例(legend)
fig = plt.figure()
ax = fig.add_subplot(1,1, 1)
ax.plot(np.random.randn(1000).cumsum(), 'k', label='one') #这里不写label的话,后面图例就不会显示
ax.plot(np.random.randn(1000).cumsum(), 'g--', label='two')
ax.plot(np.random.randn(1000).cumsum(), 'b.', label='three')
ax.legend(loc='best') #这里是将每条线段对应哪个label显示出来,删除这句也不影响上面三条线段的显示,loc告诉将图例放在哪个位置,还有其他center,right等选项
添加基本几何图形
fig = plt.figure()
ax = fig.add_subplot(1, 1, 1)
ax.set_xlim([0, 10])
ax.set_ylim([0, 10])
#以下函数第一个参数都是点坐标
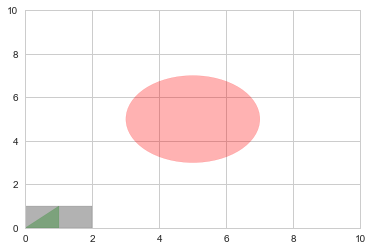
rect = plt.Rectangle((0, 0), 2, 1, color='k', alpha=0.3)
circ = plt.Circle((5, 5), 2, color='r', alpha=0.3)
pgon = plt.Polygon([[0, 0], [1, 1], [1, 0]], color='g', alpha=0.3)
ax.add_patch(rect)
ax.add_patch(circ)
ax.add_patch(pgon)
保存图片
plt.savefig('figpath.png', dpi=400, bbox_inches='tight')
#函数会根据输入的文件名后缀自动判断保存类型, dpi设置分辨率, bbox_inches表示要保存的部分tight是土建处图像周围白边
#还有参数edgecolor,facecolor可以设置背景色,format显示设置文件格式
关于matlibplot全局配置
plt.rc('figure', figsize=(10,10))
#第一个参数是想要设置的对象,第二个是参数配置
Pandas画图函数
Series和DataFrame都有用于生成各类图表的plot方法
Series
s = Series(np.random.rand(1000).cumsum(), index=np.arange(0, 1000, 1))
s.plot()
DataFrame
df = DataFrame(np.random.randn(10, 4).cumsum(0), columns=['A', 'B', 'C', 'D'],
              index=np.arange(0,100,10))
fig, axes = plt.subplots(2, 2)
df.plot(kind='bar', ax=axes[0,0]) #ax参数是表明要在其上进行绘制
df.plot(kind='line', ax=axes[0,1])
df.plot(kind='bar', ax=axes[1,0])
df.plot(kind='barh', ax=axes[1,1])
#plot还可以设置style('ko--'等), alpha, logy(在Y轴上对数标尺), rot(旋转刻度标签) xticks xlim等
这里有一个问题,就是这里书上没有一个明确的对于Series或者DataFrame plot方法的解释,因为不会所以对我不可控
one-hot编码
- 对于离散属性并且之间的取值没有大小意义,一般采取one-hot编码也就是对每一个取值都用一个0,1表示
- 对于离散属性取值有大小意义的,直接映射成1~n
pd.get_dummies可以很方便的将离散数据转换成one-hot编码
pd.get_dummies(data_train.Sex[:8])
这里需要注意的是可能测试数据集和训练数据集不一致
比如训练数据集A属性有3个取值,测试数据集中只有2个取值,这样使用one-hot的话,测试数据集就会缺少一个属性列.(这里我在Titanic遇到了,其中我把训练数据集中缺失当做一个属性,而测试数据集中并没有缺失,导致debug半天.这里还是需要预先对数据集仔细分析)
axis=1 表示函数对列上进行作用
axis=0 表示函数对行上进行作用
关于seaborn画图介绍
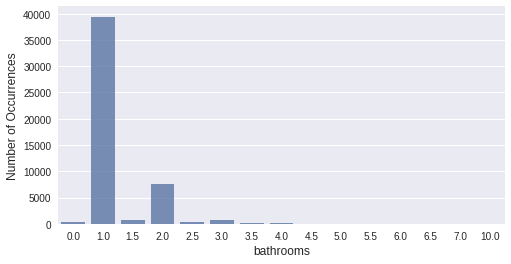
sns.barplot(cnt_srs.index, cnt_srs.values, alpha=0.8, color=color[0])
train_df['bathrooms'].ix[train_df['bathrooms']>3] = 3
plt.figure(figsize=(8,4))
sns.violinplot(x='interest_level', y='bathrooms', data=train_df)
plt.xlabel('Interest level', fontsize=12)
plt.ylabel('bathrooms', fontsize=12)
plt.show()
sns.violinplot(x=“TARGET”, y=“ZCZB”, data=test2[test2[“ZCZB”].notnull()])
sns.swarmplot(x=“TARGET”, y=“ZCZB”, data=test2[test2[“ZCZB”].notnull()])
画出各个变量和目标值的协方差
# Let us just impute the missing values with mean values to compute correlation coefficients #
mean_values = train_df.mean(axis=0)
train_df_new = train_df.fillna(mean_values, inplace=True)

# Now let us look at the correlation coefficient of each of these variables #
x_cols = [col for col in train_df_new.columns if col not in ['logerror'] if train_df_new[col].dtype=='float64']

labels = []
values = []
for col in x_cols:
    labels.append(col)
    values.append(np.corrcoef(train_df_new[col].values, train_df_new.logerror.values)[0,1])
corr_df = pd.DataFrame({'col_labels':labels, 'corr_values':values})
corr_df = corr_df.sort_values(by='corr_values')

ind = np.arange(len(labels))
width = 0.9
fig, ax = plt.subplots(figsize=(12,40))
rects = ax.barh(ind, np.array(corr_df.corr_values.values), color='y')
ax.set_yticks(ind)
ax.set_yticklabels(corr_df.col_labels.values, rotation='horizontal')
ax.set_xlabel("Correlation coefficient")
ax.set_title("Correlation coefficient of the variables")
#autolabel(rects)

#设置label的字体大小
ax.tick_params(axis='both', which='major', labelsize=30)
ax.tick_params(axis='both', which='minor', labelsize=24)
plt.show()


