JVM监控工具 Jprofiler
Jprofiler
官方下载地址 ,
https://www.ej-technologies.com/download/jprofiler/files ,
E:\工作内容\监控工具\jprofiler ,
1个小时 jvm 检测工具使用 ;
--
jprofiler(监控app服务器为主) ,
JProfiler使用详细教程学习笔记(基础教程 ,可以从这边起步), √
http://www.cnblogs.com/langtianya/p/3172180.html,
Java剖析工具JProfiler入门使用教程:查找内存泄漏的方法 ,
https://www.evget.com/article/2013/5/22/18963.html,
java性能测试 jprofiler的安装、配置、使用详解,
http://jingyan.baidu.com/article/00a07f38bcdb5f82d128dc46.html,
Jprofiler 三种监控模式
三、JProfiler的监控方式介绍:
使用JProfiler监视JVM时,对连接的时机控制有以下几种:
1. 等待模式
wait for a connection from the Jprofiler GUI,此模式为,在启动容器(Weblogic/Tomcat)时,需要等Jprofiler连接后才能启动; JVM TI是采用事件通知方式告知JProfiler相关的 Jvm的状态变化,等待模式可以不漏掉通知。
2. 非等待模式
Start Immeditely,此模式下, 容器(Weblogic/Tomcat)独立启动,Jprofiler随时可以连接;
3. 离线模式
Profile offline, Jprofiler GUI cannot connect 此模式为离线模式,生成相关记录文件事后分析;
使用记录教程
基本使用教程
看pdf文档 :
(1)jprofiler 本地有演示工具,自助入门 ;
--
E:\工作内容\监控工具\jprofiler\JProfiler入门教程-1.1(V1.1)pdf.pdf ;
监控内存泄露,
Momory Views = Live memory --> All Objects
① 实例创建数量 ;
② 实例内存占用情况 ;
③ 实例引用情况 ;
监控线程阻塞情况:
① 查看哪些线程被阻塞 ;
② 可以通过记录的影响,快进和倒退查看线程被阻塞的实际情况 ;
(2)jprofiler 本地起服务器,比如,tomcat 测试 ;
(3)jprofiler 远程调试试用一下 ;
另外提的一点是,Generic application,是监视一般的Java程序 。
创建本地监控容器(以tomcat为例) ,
(1)监视本地的Tomcat, 看似是本地,其实JProfiler GUI在一个单独的JVM里启动,他与被监视的目标jvm之间通过socket通讯,目的为了不干扰目标JVM。
(2)wait 模式, 先启动jprofiler , 在启动tomcat的 startup_jprofiler.bat ;
远程监控容器(以tomcat为例)
(1)其实就是windows为一个gui安装软件,和linux上安装一个软件(linux上也要有与windows一样的容器版本),
(2)先在windows本地一个tomcat生成一个*.sh的启动脚本,再拷到服务器上 ;
(3)然后在jprofile配置远程的容器IP和监控端口 ;
以tomcat 容器启动为例
(1) 启动 jprofiler , 等待模式 ,
(2) 启动 tomcat 的 , startup_jprofiler.bat ;
(3) 点击jprofiler 办启动模式 ,”ok” 按钮继续 , jprofiler 会自动连接上 ;
远程的tomcat容器监控例子(已实践)
参考信息 ,
JProfiler9.1远程监控Tomcat-yc ,
http://www.51testing.com/html/00/130600-3708260.html ,
其他参考信息 ,
jprofiler9.2监控远程服务器部署tomcat ,
https://www.douban.com/note/568846249/ ,
JProfiler9.2进行本地和远程JVM的性能监控 ,
https://www.douban.com/note/568711292/ ,
实际 tomcat 远程操作的例子 ,
192.168.29.100 安装后的bin目录 ,
/app/mcrouter/jprofiler9/bin ,
(1)远程拷贝 E:\工作内容\监控工具\jprofiler\jprofiler_linux_9_2.sh 到服务端进行安装,
注意:选择自定义安装目录比较容易查找 ,
(2)在客户端的jprofiler 选择远程操作和web容器 ,生成对应的的,D:\apache-tomcat-7.0.62\bin\ startup_jprofiler.sh ,
(3)服务端的tomcat和客户端的 tomcat版本要一致 ,
把tomcat拷贝到监控的服务器上 ;
并把生成的D:\apache-tomcat-7.0.62\bin\ startup_jprofiler.sh ,拷贝到对应的tomcat的目录下 ;
(4) 先启动 监控服务端的 startup_jprofiler.sh
./ startup_jprofiler.sh ;
(6) 客户端启动 ,配置的远程 remote session ;
(7) 连接上,就可以监控相应的jprofile 了 ;
注意:windows和linux两个安装包的版本需要一致,否则远程连接时,会提示版本不匹配!
以 main java 程序启动的方式(远程调用,已实践)
本地参考信息 ,
E:\工作内容\监控工具\jprofiler\ JProfiler入门教程-1.1(V1.1)pdf.pdf ;
参考信息 ,
JProfiler9.1远程监控Tomcat-yc ,
http://www.51testing.com/html/00/130600-3708260.html ,
Java main 程序 启动远程调试 ,
服务器端安装 jprofiler 插件
(1) 可以上传 *.sh 脚本 程序 上传到服务器 ,执行安装操作 ,先在服务端的linux服务器安装 ,
把 jprofiler_linux_7_1_2.sh 上传到到服务器,假设路径为 /opt/jprofiler7 执行以下命令:
# cd /opt/jprofiler7
# chmod +x *.sh
# ./jprofiler_linux_7_1_2.sh -c 按照提示来安装,提示都很简单,不在多说。 注意,这里的 -c 意思是用字符方式来安装,如果机器上没有 图形界面 则加上该参数. 注意安装的路径的修改,看下图:
第一步: 输入o 回车
第二步: 输入2 回车,意思是自定义,可以在后面改就安装路径(建议还是选择默认的吧)
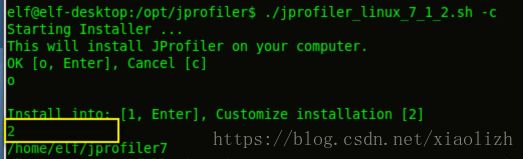
安装路径选择 /opt/jprofiler7
zd939955019
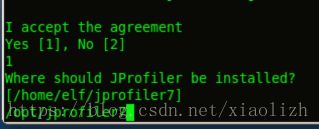
基本一路OK啊、同意啊 什么的。没有要求输入序列号。
注意:本地用的是 ,jprofiler_linux_9_2.sh ; - 这个版本 ,
(2)要引入环境变量 ,
export LD_LIBRARY_PATH=:/app/emservice/jprofiler9/bin/linux-x64 ,加入 .bashrc 环境变量的时候 ,
#cd ~
一定要 #source .bashrc
注意:有时,会自动 在 .bashrc加入,有时不会自动加入,要手工加入以下 ;
查看当前用户变量 ,
#env
参考信息 ,
JProfiler9.2进行本地和远程JVM的性能监控 ,
https://www.douban.com/note/568711292/?type=rec ,
已经尝试 在 192.168.29.100 服务器上 安装过 ,
具体地址 , /app/mcrouter/opt/jprofiler9 ;
已经在 192.168.29.170 服务器安装,并启动 EMService ,并远程连接监控 ;
注意:关于启动 ,服务端只要加上启动命令, jprofiler9 自会启动 ,比如 ,
java -agentpath:/app/emservice/jprofiler9/bin/linux-x64/libjprofilerti.so=port=8849 -jar em-server-1.0.0-SNAPSHOT.jar > log.file 2>&1 & ;
不需要去 bin 目录下启动什么 sh 文件 ;
其他安装jprofiler9的信息 ,但还是以上面的手工记录的为主 ,
使用JProfiler9对远程Linux服务器Java应用进行性能检测 ,
http://zl1030.blog.51cto.com/274507/1686483 ,
客户端配置jprofiler , 并启动 远程监控的 main java 程序
(1)客户端打开jprofiler ;
(2)客户端连接配置
如果直接启动的是java应用程序的话,直接启动就可以了 ;
1). 运行 JProfiler 。忽略快速启动菜单。
2). 选择 Session->Integration Wizard->New Server Integratation
3). 选择 一般应用程序

4). 选择 On a remote computer;Platform of remote computer 选择 Linux x86/AMD 64; Next
5). 选择服务器的 JDK 环境,这里是:Oracle,1.6.0,hotspot,(注意是32位或64位) Next 6). 选择启动模式:这里选第二种,非等待模式 Next
7). 输入服务器 IP( 例如, 192.168.3.170 ), Next
8). 输入服务器上的 jprofiler 的安装路径,如 /app/emservice/jprofiler9 ,用于加载模块 。 Next
9). 生成JVM启动参数:-agentpath:/app/emservice/jprofiler9/bin/linux-x64/libjprofilerti.so=port=8849,nowait
输入端口:这里是默认值 8849;Next
10 ). 在启动服务端Java程序时要加入这个参数。
执行远程jar 的 java 程序 ,请按照下面例子执行 ,
java -agentpath:/app/emservice/jprofiler9/bin/linux-x64/libjprofilerti.so=port=8849 -jar em-server-1.0.0-SNAPSHOT.jar > log.file 2>&1 &
java -agentpath:/app/emservice/jprofiler9/bin/linux-x64/libjprofilerti.so=port=8849,nowait -jar em-server-1.0.0-SNAPSHOT.jar > log.file 2>&1 &
如果要加入jvm参数的话,如下例子,
java -jar test.jar -Xms32m -Xmx512m -agentpath:/opt/jprofiler7/bin/linux-x86/libjprofilerti.so=port=8849
注意:现在项目中加入jprofiler 的例子如下 ,
(1)启动 的时候 ,等待 jprofiler 连接上,才能正式启动 ,
java -Xms7168M -Xmx7168M -agentpath:/app/emservice/jprofiler9/bin/linux-x64/libjprofilerti.so=port=8849 -jar em-server-1.0.11.jar > log.file 2>&1 &
(2)启动的时候,不用等待 jprofiler 连接 ,可以先启动 ,后 jprofiler 再连接上,
java -Xms7168M -Xmx7168M -agentpath:/app/emservice/jprofiler9/bin/linux-x64/libjprofilerti.so=port=8849,nowait -jar em-server-1.0.11.jar > log.file 2>&1 &
服务端和客户端执行顺序
(1)可以先配置客户端的jprofiler ;
(2)启动服务器的 jar 的 java 程序 ;
(3)客户端的jprofiler 连接远程程序 ;
本地调试样例(结合java server容器来操作)
http://www.cnblogs.com/langtianya/p/3172180.html ,
本地的web包例子在,
D:\apache-tomcat-7.0.62\webapps\TestWeb ;
Jsp跑多个实例 ,
http://localhost:8082/TestWeb/init1.jsp,
http://localhost:8082/TestWeb/init2.jsp,
jprofiler 和 eclipse 集成(包括测试单独程序的运行效果)
jprofiler 和 eclipse 如何集成
Eclipse集成JProfiler(性能测试插件JProfiler),
http://jingyan.baidu.com/article/851fbc37e5f1483e1e15ab4c.html ,
测试单独程序的运行效果
eclipse 集成 jprofiler 有个缺点,
就是 程序执行完后,这是因为Jvm运行完毕之后会关闭,所以部分数据会丢失。会报,“jprofiler jvm has exited” , 怎么设置都没用 ;
如果一直执行的话,就可以监控到数据 ,因为 jvm 一直在运行 ;
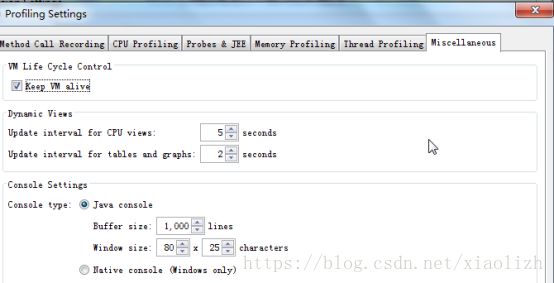
解决方案,jprofiler 的参数设置 ,Miscellaneous --> Keep Vm alive ;
执行注意过程 ,
(1)在elicpse 中 ,main 程序中, “ profiler as ” –> “java application” ;
(2)执行的时候会提醒你,打开新的jprofiler 新窗口(最好选择打开新的窗口) ,还是保留当前 jprofiler窗口 ;
(3)“Miscellaneous --> Keep Vm alive ” 注意当前选择 ,
弹出的jprofiler 会提示 ,

注意:
![]()
的选择 ,
点击 “Edit” 进去 ,注意:选择对应的选项,如图,

再选择对应的,如图,

选择 Miscellaneous --> Keep Vm alive ,
点击 OK 依次退出 ,
最后 jprofiler 会依然保持 java程序运行的结果,如图,
![]()
jprofiler 的其他使用参考资料
jprofiler 的其他使用参考资料 ,
Jprofiler9 远程监控Linux下JBoss ,
http://blog.csdn.net/u010028869/article/details/50410225 ;