Kaggle项目 - Hotel Booking Demand
%matplotlib inline
import pandas as pd
import numpy as np
import matplotlib.pyplot as plt
import seaborn as sns
plt.rc("font",family="SimHei",size="12")  #用于解决中文显示不了的问题
sns.set_style("whitegrid")
Exploratory data analysis (EDA) 探索性数据分析
一、Data Clean 数据清洗
1.1对空值、NA进行处理
data = pd.read_csv('hotel_booking_demand.csv')
data.head()
| hotel | is_canceled | lead_time | arrival_date_year | arrival_date_month | arrival_date_week_number | arrival_date_day_of_month | stays_in_weekend_nights | stays_in_week_nights | adults | ... | deposit_type | agent | company | days_in_waiting_list | customer_type | adr | required_car_parking_spaces | total_of_special_requests | reservation_status | reservation_status_date | |
|---|---|---|---|---|---|---|---|---|---|---|---|---|---|---|---|---|---|---|---|---|---|
| 0 | Resort Hotel | 0 | 342 | 2015 | July | 27 | 1 | 0 | 0 | 2 | ... | No Deposit | NaN | NaN | 0 | Transient | 0.0 | 0 | 0 | Check-Out | 2015-07-01 |
| 1 | Resort Hotel | 0 | 737 | 2015 | July | 27 | 1 | 0 | 0 | 2 | ... | No Deposit | NaN | NaN | 0 | Transient | 0.0 | 0 | 0 | Check-Out | 2015-07-01 |
| 2 | Resort Hotel | 0 | 7 | 2015 | July | 27 | 1 | 0 | 1 | 1 | ... | No Deposit | NaN | NaN | 0 | Transient | 75.0 | 0 | 0 | Check-Out | 2015-07-02 |
| 3 | Resort Hotel | 0 | 13 | 2015 | July | 27 | 1 | 0 | 1 | 1 | ... | No Deposit | 304.0 | NaN | 0 | Transient | 75.0 | 0 | 0 | Check-Out | 2015-07-02 |
| 4 | Resort Hotel | 0 | 14 | 2015 | July | 27 | 1 | 0 | 2 | 2 | ... | No Deposit | 240.0 | NaN | 0 | Transient | 98.0 | 0 | 1 | Check-Out | 2015-07-03 |
5 rows × 32 columns
data.info()
RangeIndex: 119390 entries, 0 to 119389
Data columns (total 32 columns):
hotel                             119390 non-null object
is_canceled                       119390 non-null int64
lead_time                         119390 non-null int64
arrival_date_year                 119390 non-null int64
arrival_date_month                119390 non-null object
arrival_date_week_number          119390 non-null int64
arrival_date_day_of_month         119390 non-null int64
stays_in_weekend_nights           119390 non-null int64
stays_in_week_nights              119390 non-null int64
adults                            119390 non-null int64
children                          119386 non-null float64
babies                            119390 non-null int64
meal                              119390 non-null object
country                           118902 non-null object
market_segment                    119390 non-null object
distribution_channel              119390 non-null object
is_repeated_guest                 119390 non-null int64
previous_cancellations            119390 non-null int64
previous_bookings_not_canceled    119390 non-null int64
reserved_room_type                119390 non-null object
assigned_room_type                119390 non-null object
booking_changes                   119390 non-null int64
deposit_type                      119390 non-null object
agent                             103050 non-null float64
company                           6797 non-null float64
days_in_waiting_list              119390 non-null int64
customer_type                     119390 non-null object
adr                               119390 non-null float64
required_car_parking_spaces       119390 non-null int64
total_of_special_requests         119390 non-null int64
reservation_status                119390 non-null object
reservation_status_date           119390 non-null object
dtypes: float64(4), int64(16), object(12)
memory usage: 29.1+ MB
data.isnull().sum() #空值计数
hotel                                  0
is_canceled                            0
lead_time                              0
arrival_date_year                      0
arrival_date_month                     0
arrival_date_week_number               0
arrival_date_day_of_month              0
stays_in_weekend_nights                0
stays_in_week_nights                   0
adults                                 0
children                               4
babies                                 0
meal                                   0
country                              488
market_segment                         0
distribution_channel                   0
is_repeated_guest                      0
previous_cancellations                 0
previous_bookings_not_canceled         0
reserved_room_type                     0
assigned_room_type                     0
booking_changes                        0
deposit_type                           0
agent                              16340
company                           112593
days_in_waiting_list                   0
customer_type                          0
adr                                    0
required_car_parking_spaces            0
total_of_special_requests              0
reservation_status                     0
reservation_status_date                0
dtype: int64
- 缺失值处理方法:可以删除,可以零填充,均值填充,众数填充等
- 从上述结果可以看到children、country、agent、company都有缺失值,company甚至达到112593,总行才119390
- 对四种缺失值进行判断处理:
- comapny缺失太多,删除
- children很少,用众数填充
- country国家众数填充
- agent旅游机构考虑0填充,代表不属于任何机构
df = data.copy()
df.drop(['company'],axis=1,inplace=True)
df['agent'].fillna(0,inplace=True)
df['children'].fillna(df['children'].mode()[0],inplace=True)
df['country'].fillna(df['country'].mode()[0],inplace=True)
df.isnull().sum()
hotel                             0
is_canceled                       0
lead_time                         0
arrival_date_year                 0
arrival_date_month                0
arrival_date_week_number          0
arrival_date_day_of_month         0
stays_in_weekend_nights           0
stays_in_week_nights              0
adults                            0
children                          0
babies                            0
meal                              0
country                           0
market_segment                    0
distribution_channel              0
is_repeated_guest                 0
previous_cancellations            0
previous_bookings_not_canceled    0
reserved_room_type                0
assigned_room_type                0
booking_changes                   0
deposit_type                      0
agent                             0
days_in_waiting_list              0
customer_type                     0
adr                               0
required_car_parking_spaces       0
total_of_special_requests         0
reservation_status                0
reservation_status_date           0
dtype: int64
- 再次检测,确认数据没有NA值,清洗完成
1.2 异常值处理:
- 客户数量是0的剔除,即adult+children+babies=0的情况
- 查看其他极大极小值
df = df.eval('total_person = babies+children+adults')
df = df[df['total_person'] > 0]
(df.total_person==0).value_counts() #确认剔除干净
False    119210
Name: total_person, dtype: int64
df.plot(legend=False) #快速查看异常值,发现一个adr异常值
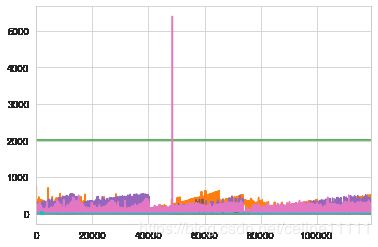
df[df.adr>1000] #查找到1条异常值,adr高达5400,删除这条异常值
df = df[~(df.adr>1000)]
1.3 数据整理
- 字段说明文件中提到SC/undefined是同一类型,所以对meal列进行处理
- 把月份更换成数字,方便按照顺序排列
df['meal'].replace('SC','Undefined',inplace=True)
df['arrival_date_month'] = df['arrival_date_month'].map({'January':1, 'February': 2, 'March':3, 'April':4, 'May':5, 'June':6, 'July':7,
                                                            'August':8, 'September':9, 'October':10, 'November':11, 'December':12})
二、Data Analysis 数据分析
1) 对比两家酒店订单取消的情况
1. 堆积条形图,对比两家酒店的取消情况
new = df[['hotel','is_canceled','adr']] #adr列是为了计数,任意列都可以
new.tail()
| hotel | is_canceled | adr | |
|---|---|---|---|
| 119385 | City Hotel | 0 | 96.14 |
| 119386 | City Hotel | 0 | 225.43 |
| 119387 | City Hotel | 0 | 157.71 |
| 119388 | City Hotel | 0 | 104.40 |
| 119389 | City Hotel | 0 | 151.20 |
pivot_df = pd.pivot_table(new,values='adr',index='hotel',columns='is_canceled',aggfunc='count')
pivot_df
| is_canceled | 0 | 1 |
|---|---|---|
| hotel | ||
| City Hotel | 46084 | 33078 |
| Resort Hotel | 28927 | 11120 |
pivot_df.plot.bar(stacked=True,color=['tomato','c']) #stacked默认False,并列条形图,True改为堆积条形图,方便对比总数
plt.xticks(rotation=30) #x轴参数倾斜30度显示
(array([0, 1]), )
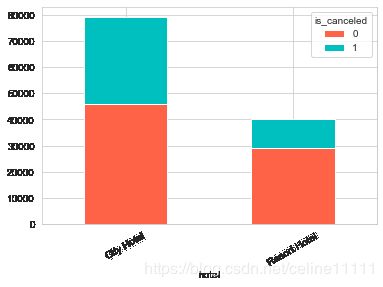
- 从上述堆积条形图可以看出City Hotel的整体预定量远大于Resort Hotel,取消比例也大于Resort Hotel
2. 再增加一个因变量,查看新客老客取消对比
sns.countplot(x='is_canceled',hue='is_repeated_guest',data=df,palette='Set2')
plt.show()

- 回头客数量仅有很少一部分,新客取消概率更高
- 如果有行业平均数值,或者历史同期数值,对比分析的话意义更大
2) 查看不同的细分市场的取消比率
plt.figure(figsize=(10,6))
sns.countplot(x='market_segment',hue='is_canceled',data=df,palette='Set2')
plt.title('Cancellation of different segment')
plt.xticks(rotation=30)
plt.show()
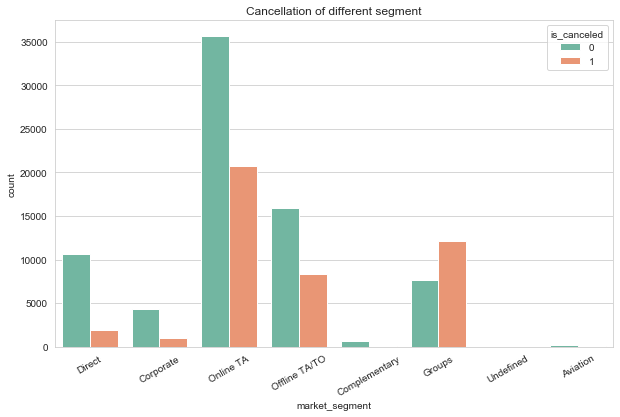
- 可以看到团队预订Groups取消概率最大,其次是线上旅行团Online TA,次之线下旅行团offline TA/TO
3) 查看不同月份的取消比率
# help(sns.barplot)
sns.barplot('arrival_date_month',y='is_canceled',data=df)
plt.xticks(rotation=30)
plt.show()

4) 不同房型的费用
### 注意在开始之前,要先剔除无效订单,即选择预订成功的数据is_canceled为0的数据
df_valid = df[df.is_canceled==0]
plt.figure(figsize=(10,6))
sns.boxplot(x='reserved_room_type',y='adr',hue='hotel',data=df_valid,palette='Set2')
plt.title('Different Room Price')
plt.ylim(0, 400)
plt.show()
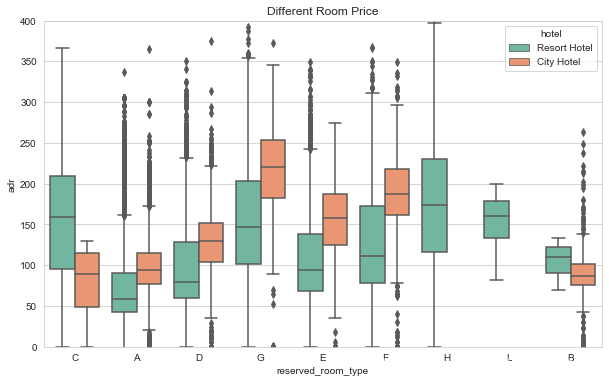
- 箱型图可以直观的看出异常值,和大部分数据的分布情况;
5) 查看不同月份的订单量
group_df = df_valid.groupby(['arrival_date_month','hotel']).count().reset_index()
group_df.head()
| arrival_date_month | hotel | is_canceled | lead_time | arrival_date_year | arrival_date_week_number | arrival_date_day_of_month | stays_in_weekend_nights | stays_in_week_nights | adults | ... | deposit_type | agent | days_in_waiting_list | customer_type | adr | required_car_parking_spaces | total_of_special_requests | reservation_status | reservation_status_date | total_person | |
|---|---|---|---|---|---|---|---|---|---|---|---|---|---|---|---|---|---|---|---|---|---|
| 0 | 1 | City Hotel | 2249 | 2249 | 2249 | 2249 | 2249 | 2249 | 2249 | 2249 | ... | 2249 | 2249 | 2249 | 2249 | 2249 | 2249 | 2249 | 2249 | 2249 | 2249 |
| 1 | 1 | Resort Hotel | 1866 | 1866 | 1866 | 1866 | 1866 | 1866 | 1866 | 1866 | ... | 1866 | 1866 | 1866 | 1866 | 1866 | 1866 | 1866 | 1866 | 1866 | 1866 |
| 2 | 2 | City Hotel | 3051 | 3051 | 3051 | 3051 | 3051 | 3051 | 3051 | 3051 | ... | 3051 | 3051 | 3051 | 3051 | 3051 | 3051 | 3051 | 3051 | 3051 | 3051 |
| 3 | 2 | Resort Hotel | 2308 | 2308 | 2308 | 2308 | 2308 | 2308 | 2308 | 2308 | ... | 2308 | 2308 | 2308 | 2308 | 2308 | 2308 | 2308 | 2308 | 2308 | 2308 |
| 4 | 3 | City Hotel | 4049 | 4049 | 4049 | 4049 | 4049 | 4049 | 4049 | 4049 | ... | 4049 | 4049 | 4049 | 4049 | 4049 | 4049 | 4049 | 4049 | 4049 | 4049 |
5 rows × 32 columns
city_df = group_df[group_df.hotel == 'City Hotel']
Resort_df = group_df[group_df.hotel == 'Resort Hotel']
plt.figure(figsize=(10,6))
plt.title('Monthly_Customers')
plt.plot(Resort_df.arrival_date_month,Resort_df.is_canceled,label='Resort Hotel')
plt.plot(city_df.arrival_date_month,city_df.is_canceled,label='City Hotel')
plt.legend()
plt.show()

- 两种酒店的订单趋势不同,经营模式不同
- 城市酒店3至10月都很高,订单量在4000以上,而11至2月订单较低,分析原因是这段时间国外有很多节日,万圣节/圣诞节/新年,所以出门旅行的概率较低
- 度假酒店趋势更稳定一些,整体上也是3至10较高,在2500单左右浮动,不过6月/9月有一个低谷,降到2000单左右
- 条形图更简单,下面是另一种对比方法
plt.figure(figsize=(10,6))
bar = sns.countplot(x='arrival_date_month',hue='hotel',data=df_valid,palette='Set2') #使用有效订单数据
plt.title('Monthly_Customers')
plt.show()

6) 查看不同月份的人均消费价格,是否会随着订单量而变动
- 首先定义人均价格算法,ADR=客房收入/实际售出客房数量,已售客房平均房价;其中数据源中有3列人员,婴儿/儿童/成人,此处我们仅计算成人+儿童,婴儿剔除不计人数,利用ADR/人数,得到人均价格;(记得剔除人数为0的情况)
df_valid.loc[:,'avg'] = df_valid['adr'] / (df_valid['total_person'])
df_valid.head()
| hotel | is_canceled | lead_time | arrival_date_year | arrival_date_month | arrival_date_week_number | arrival_date_day_of_month | stays_in_weekend_nights | stays_in_week_nights | adults | ... | agent | days_in_waiting_list | customer_type | adr | required_car_parking_spaces | total_of_special_requests | reservation_status | reservation_status_date | total_person | avg | |
|---|---|---|---|---|---|---|---|---|---|---|---|---|---|---|---|---|---|---|---|---|---|
| 0 | Resort Hotel | 0 | 342 | 2015 | 7 | 27 | 1 | 0 | 0 | 2 | ... | 0.0 | 0 | Transient | 0.0 | 0 | 0 | Check-Out | 2015-07-01 | 2.0 | 0.0 |
| 1 | Resort Hotel | 0 | 737 | 2015 | 7 | 27 | 1 | 0 | 0 | 2 | ... | 0.0 | 0 | Transient | 0.0 | 0 | 0 | Check-Out | 2015-07-01 | 2.0 | 0.0 |
| 2 | Resort Hotel | 0 | 7 | 2015 | 7 | 27 | 1 | 0 | 1 | 1 | ... | 0.0 | 0 | Transient | 75.0 | 0 | 0 | Check-Out | 2015-07-02 | 1.0 | 75.0 |
| 3 | Resort Hotel | 0 | 13 | 2015 | 7 | 27 | 1 | 0 | 1 | 1 | ... | 304.0 | 0 | Transient | 75.0 | 0 | 0 | Check-Out | 2015-07-02 | 1.0 | 75.0 |
| 4 | Resort Hotel | 0 | 14 | 2015 | 7 | 27 | 1 | 0 | 2 | 2 | ... | 240.0 | 0 | Transient | 98.0 | 0 | 1 | Check-Out | 2015-07-03 | 2.0 | 49.0 |
5 rows × 33 columns
df_valid.avg.describe()
count    75011.000000
mean        54.553351
std         28.149583
min         -3.190000
25%         37.200000
50%         49.425000
75%         66.072500
max        510.000000
Name: avg, dtype: float64
plt.figure(figsize=(10,6))
sns.lineplot(x='arrival_date_month',y='avg',hue='hotel',ci='sd',data=df_valid,palette='Set2')
plt.title('Average Price by Month')
Text(0.5, 1.0, 'Average Price by Month')

- 可以看出基本城市酒店的价格大部分时间都高于度假酒店,除了6至8月一段时间是低于
- 城市酒店的平均房价基本在60左右,上下约15%浮动
- 度假酒店的平均房价上下浮动更大,最高出现在8月,最低出现在1/11月,价格之差高达约165%
- 7/8月两种酒店的订单量都达到峰值,而价格只有度假酒店较高,酒店价格反而有下降趋势,分析可能这个时间大家习惯去度假