kaggle 旧金山犯罪案件分类预测
kaggle上对旧金山城市的犯罪案件进行分类,属于多分类问题,提供的数据特征包含时间、地点、描述等。
导入数据和包
#imports
import pandas as pd
import numpy as np
import matplotlib.pyplot as plt
import time as systime
import datetime as dt
import string
import seaborn as sns
import matplotlib.colors as colors
%matplotlib inline
train = pd.read_csv('train.csv')
test = pd.read_csv('test.csv')train.info()
RangeIndex: 878049 entries, 0 to 878048
Data columns (total 9 columns):
Dates         878049 non-null object
Category      878049 non-null object
Descript      878049 non-null object
DayOfWeek     878049 non-null object
PdDistrict    878049 non-null object
Resolution    878049 non-null object
Address       878049 non-null object
X             878049 non-null float64
Y             878049 non-null float64
dtypes: float64(2), object(7)
memory usage: 60.3+ MB
train.shapetrain.head(3)| Dates | Category | Descript | DayOfWeek | PdDistrict | Resolution | Address | X | Y | |
|---|---|---|---|---|---|---|---|---|---|
| 0 | 2015-05-13 23:53:00 | WARRANTS | WARRANT ARREST | Wednesday | NORTHERN | ARREST, BOOKED | OAK ST / LAGUNA ST | -122.425892 | 37.774599 |
| 1 | 2015-05-13 23:53:00 | OTHER OFFENSES | TRAFFIC VIOLATION ARREST | Wednesday | NORTHERN | ARREST, BOOKED | OAK ST / LAGUNA ST | -122.425892 | 37.774599 |
| 2 | 2015-05-13 23:33:00 | OTHER OFFENSES | TRAFFIC VIOLATION ARREST | Wednesday | NORTHERN | ARREST, BOOKED | VANNESS AV / GREENWICH ST | -122.424363 | 37.800414 |
test.shapetest.head(3)| Id | Dates | DayOfWeek | PdDistrict | Address | X | Y | |
|---|---|---|---|---|---|---|---|
| 0 | 0 | 2015-05-10 23:59:00 | Sunday | BAYVIEW | 2000 Block of THOMAS AV | -122.399588 | 37.735051 |
| 1 | 1 | 2015-05-10 23:51:00 | Sunday | BAYVIEW | 3RD ST / REVERE AV | -122.391523 | 37.732432 |
| 2 | 2 | 2015-05-10 23:50:00 | Sunday | NORTHERN | 2000 Block of GOUGH ST | -122.426002 | 37.792212 |
数据分析
train.isnull().sum()Dates 0
Category 0
Descript 0
DayOfWeek 0
PdDistrict 0
Resolution 0
Address 0
X 0
Y 0
dtype: int64
Category
#可以通过groupby().size()方法返回分组后的统计结果
cate_group = train.groupby(by='Category').size()
cate_group
#Series类型
Category
ARSON 1513
ASSAULT 76876
BAD CHECKS 406
BRIBERY 289
BURGLARY 36755
DISORDERLY CONDUCT 4320
DRIVING UNDER THE INFLUENCE 2268
DRUG/NARCOTIC 53971
DRUNKENNESS 4280
EMBEZZLEMENT 1166
EXTORTION 256
FAMILY OFFENSES 491
FORGERY/COUNTERFEITING 10609
FRAUD 16679
GAMBLING 146
KIDNAPPING 2341
LARCENY/THEFT 174900
LIQUOR LAWS 1903
LOITERING 1225
MISSING PERSON 25989
NON-CRIMINAL 92304
OTHER OFFENSES 126182
PORNOGRAPHY/OBSCENE MAT 22
PROSTITUTION 7484
RECOVERED VEHICLE 3138
ROBBERY 23000
RUNAWAY 1946
SECONDARY CODES 9985
SEX OFFENSES FORCIBLE 4388
SEX OFFENSES NON FORCIBLE 148
STOLEN PROPERTY 4540
SUICIDE 508
SUSPICIOUS OCC 31414
TREA 6
TRESPASS 7326
VANDALISM 44725
VEHICLE THEFT 53781
WARRANTS 42214
WEAPON LAWS 8555
dtype: int64
#目标分类共有多少种类型
cat_num = len(cate_group.index)
cat_numcate_group.index = cate_group.index.map(string.capwords)
cate_group.sort_values(ascending=False,inplace=True)cate_group.plot(kind='bar',logy=True,figsize=(15,10),color=sns.color_palette('coolwarm',cat_num))
plt.title('No. of Crime types',fontsize=20)
plt.show()注:请确保是最新的pandas版本,这样在画图的时候传入color或者colormap参数会得到不同颜色的柱状,我最初是0.20.0的版本,传入color参数得到的柱状颜色都是一样的,头疼了好一阵,最后在StackOverflow上找到相关问题,更新pandas版本到0.23.0后就解决了。
从上图看到,虽然数量下降曲线较平缓,但由于纵坐标是指数级的,可见数量较多的犯罪类型占比较大,从中可知该城市的主要犯罪类型集中在排名靠前的几类中。
sum(cate_group)#总共犯罪案件数量top6 = list(cate_group.index[:6])
top15 = list(cate_group.index[:15])
total = sum(cate_group)
topsum = 0
for i in top6:
topsum = cate_group[i]+topsum
print('Top6 crimes about:'+str(100*topsum/total)+'%'+' in total')
topsum=0
for i in top15:
topsum+=cate_group[i]
print('Top15 crimes about:'+str(100*topsum/total)+'%'+' in total')Top6 crimes about:65.8293557649% in total
Top15 crimes about:93.3187100037% in total
果然,60%以上的犯罪类型集中在前6种,90%以上的是前15种
PdDistrict
dis_group = train.groupby(by='PdDistrict').size()
print(len(dis_group))
dis_group
10
PdDistrict
BAYVIEW 89431
CENTRAL 85460
INGLESIDE 78845
MISSION 119908
NORTHERN 105296
PARK 49313
RICHMOND 45209
SOUTHERN 157182
TARAVAL 65596
TENDERLOIN 81809
dtype: int64
dis_group = dis_group/sum(dis_group)dis_group.index = dis_group.index.map(string.capwords)
dis_group.sort_values(ascending=True,inplace=True)
dis_group.plot(kind='barh',figsize=(15,10),fontsize=10,color=sns.color_palette('coolwarm',10))
plt.title('Frequncy. of crimes by district',fontsize=20)
plt.show()可以看出,地区之间差异还是挺大的,southern地区犯罪率较高,治安最好的是Richmond。
year/month/day
#将object类型转为datetime类型
train['date'] = pd.to_datetime(train['Dates'])train.head(1)| Dates | Category | Descript | DayOfWeek | PdDistrict | Resolution | Address | X | Y | date | |
|---|---|---|---|---|---|---|---|---|---|---|
| 0 | 2015-05-13 23:53:00 | WARRANTS | WARRANT ARREST | Wednesday | NORTHERN | ARREST, BOOKED | OAK ST / LAGUNA ST | -122.425892 | 37.774599 | 2015-05-13 23:53:00 |
train['year'] = train.date.dt.year
train['month'] = train.date.dt.month
train['day'] = train.date.dt.day
train['hour'] = train.date.dt.hourplt.figure(figsize=(8,19))
year_group = train.groupby('year').size()
plt.subplot(311)
plt.plot(year_group.index[:-1],year_group[:-1],'ks-')
plt.xlabel('year')
month_group = train.groupby('month').size()
plt.subplot(312)
plt.plot(month_group,'ks-')
plt.xlabel('month')
day_group = train.groupby('day').size()
plt.subplot(313)
plt.plot(day_group,'ks-')
plt.xlabel('day')
plt.show()从上图可知,在2010年前SF的犯罪数基本上呈递减趋势,2010后数量激增,案件高发期是在一年中的5月和10月,在每个月的月初和月末会有轻微涨幅。
Day of week
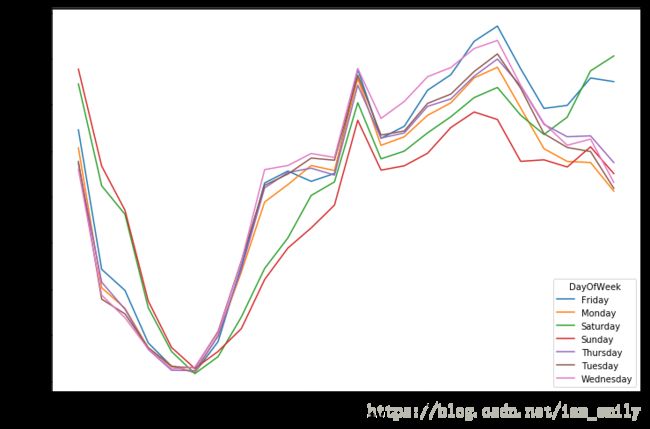
week_group = train.groupby(['DayOfWeek','hour']).size()#多重分组
week_group = week_group.unstack()#对分组后的多重索引转为xy索引

week_group.T.plot(figsize=(12,8))#行列互换后画图
plt.xlabel('hour of day',size=15)
plt.ylabel('Number of crimes',size=15)
plt.show()
可以看出,案件高发时间是在12点和18点左右,凌晨后数量会显著减少,在周五周六的晚上8点后案件发生率会比平时要高。
高发案件的时间和地点
对数量较多的前6种犯罪类型做分析:
hour
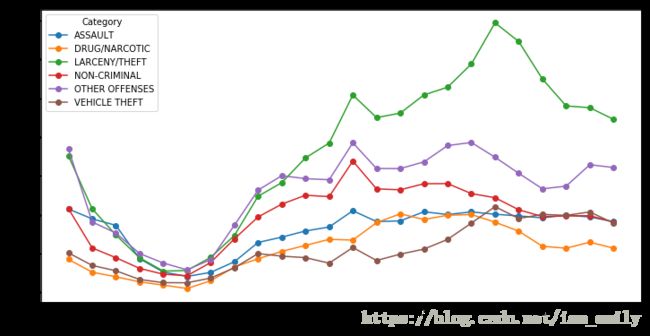
tmp = train[train['Category'].map(string.capwords).isin(top6)]
tmp_group = tmp.groupby(['Category','hour']).size()
tmp_group = tmp_group.unstack()
tmp_group.T.plot(figsize=(12,6),style='o-')
plt.show()
时间上与上述分析是一致的,对于偷盗类案件在12、18点发生率更高;assault类案件在晚上6点后没有下降趋势。
PdDistrict
tmp2 = tmp.groupby(['Category','PdDistrict']).size()
tmp2.unstack()| PdDistrict | BAYVIEW | CENTRAL | INGLESIDE | MISSION | NORTHERN | PARK | RICHMOND | SOUTHERN | TARAVAL | TENDERLOIN |
|---|---|---|---|---|---|---|---|---|---|---|
| Category | ||||||||||
| ASSAULT | 9857 | 6977 | 8533 | 11149 | 8318 | 3515 | 3202 | 12183 | 5463 | 7679 |
| DRUG/NARCOTIC | 4498 | 1805 | 2373 | 8757 | 4511 | 2573 | 999 | 9228 | 1531 | 17696 |
| LARCENY/THEFT | 10119 | 25060 | 10236 | 18223 | 28630 | 9146 | 9893 | 41845 | 11845 | 9903 |
| NON-CRIMINAL | 6099 | 10940 | 6853 | 12372 | 10240 | 5925 | 5744 | 19745 | 6919 | 7467 |
| OTHER OFFENSES | 17053 | 8901 | 13203 | 19330 | 12233 | 6184 | 5632 | 21308 | 8614 | 13724 |
| VEHICLE THEFT | 7219 | 4210 | 8960 | 7148 | 6291 | 3963 | 4117 | 4725 | 6142 | 1006 |
tmp2.unstack().T.plot(kind='bar',figsize=(12,6),rot=45)
plt.show()
从上图可知,犯罪率最高的Southern地区,偷窃类、暴力冲突类案件数量最多,车辆失窃类案件较少,猜测可能属于贫困地区,治安很好的地区Park,Richmond中,毒品、人身攻击类案件比例明显较少.
DayOfWeek
tmp3 = tmp.groupby(['Category','DayOfWeek']).size()
tmp3 = tmp3.unstack()tmp3.sum(axis=1)[0]tmp3.iloc[0]DayOfWeek
Friday 11160
Monday 10560
Saturday 11995
Sunday 12082
Thursday 10246
Tuesday 10280
Wednesday 10553
Name: ASSAULT, dtype: int64
for i in range(6):
    tmp3.iloc[i] = tmp3.iloc[i]/tmp3.sum(axis=1)[i]
tmp3| DayOfWeek | Friday | Monday | Saturday | Sunday | Thursday | Tuesday | Wednesday |
|---|---|---|---|---|---|---|---|
| Category | |||||||
| ASSAULT | 0.145169 | 0.137364 | 0.156030 | 0.157162 | 0.133280 | 0.133722 | 0.137273 |
| DRUG/NARCOTIC | 0.137481 | 0.144948 | 0.118397 | 0.113820 | 0.156640 | 0.157010 | 0.171703 |
| LARCENY/THEFT | 0.154969 | 0.134763 | 0.155615 | 0.138079 | 0.139594 | 0.136975 | 0.140006 |
| NON-CRIMINAL | 0.151499 | 0.139268 | 0.151749 | 0.140546 | 0.138878 | 0.138001 | 0.140059 |
| OTHER OFFENSES | 0.147311 | 0.140963 | 0.135748 | 0.122498 | 0.146312 | 0.149062 | 0.158105 |
| VEHICLE THEFT | 0.160149 | 0.137818 | 0.150964 | 0.139529 | 0.138636 | 0.135048 | 0.137855 |
wkm = {
    'Monday':0,
    'Tuesday':1,
    'Wednesday':2,
    'Thursday':3,
    'Friday':4,
    'Saturday':5,
    'Sunday':6
}
tmp3.columns = tmp3.columns.map(wkm)
tmp3 = tmp3.ix[:,range(7)]
tmp3| DayOfWeek | 0 | 1 | 2 | 3 | 4 | 5 | 6 |
|---|---|---|---|---|---|---|---|
| Category | |||||||
| ASSAULT | 0.137364 | 0.133722 | 0.137273 | 0.133280 | 0.145169 | 0.156030 | 0.157162 |
| DRUG/NARCOTIC | 0.144948 | 0.157010 | 0.171703 | 0.156640 | 0.137481 | 0.118397 | 0.113820 |
| LARCENY/THEFT | 0.134763 | 0.136975 | 0.140006 | 0.139594 | 0.154969 | 0.155615 | 0.138079 |
| NON-CRIMINAL | 0.139268 | 0.138001 | 0.140059 | 0.138878 | 0.151499 | 0.151749 | 0.140546 |
| OTHER OFFENSES | 0.140963 | 0.149062 | 0.158105 | 0.146312 | 0.147311 | 0.135748 | 0.122498 |
| VEHICLE THEFT | 0.137818 | 0.135048 | 0.137855 | 0.138636 | 0.160149 | 0.150964 | 0.139529 |
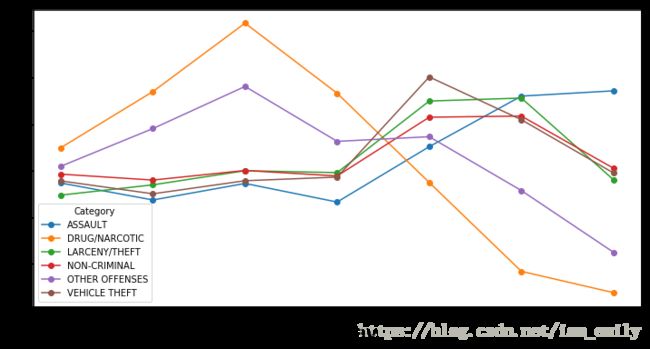
tmp3.T.plot(figsize=(12,6),style='o-')
plt.xlabel("weekday",size=20)
#plt.axes.set_xticks([])
plt.xticks([0,1,2,3,4,5,6],['Mon','Tue','Wed','Thur','Fri','Sat','Sun'])
plt.show()
趋势不太一样的是毒品类案件,在周三发生最多,周末有急剧下降的趋势;其余多数案件,除了other offenses外,都在周五周六有所增多。
month
mon_g = tmp.groupby(['Category','month']).size()
mon_g = mon_g.unstack()
for i in range(6):
    mon_g.iloc[i] = mon_g.iloc[i]/mon_g.sum(axis=1)[i]
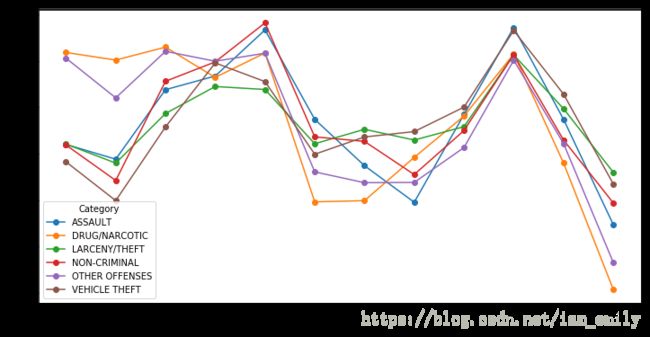
mon_g.T.plot(figsize=(12,6),style='o-')
plt.show()
分类变化趋势与总体基本一致,2-6月和8-12月是案件高发期,1-2月drug和other offense案发率较高。
高发案件的时间趋势
ddf = tmp.groupby(['Category',pd.Grouper('date')]).size()
ddf = ddf.unstack().fillna(0)
ddf = ddf.T#将时间序列设为index方便后续使用resample进行统计
ddf.indexDatetimeIndex([‘2015-05-13 23:53:00’, ‘2015-05-13 23:33:00’,
‘2015-05-13 23:30:00’, ‘2015-05-13 23:00:00’,
‘2015-05-13 22:58:00’, ‘2015-05-13 22:30:00’,
‘2015-05-13 22:06:00’, ‘2015-05-13 22:00:00’,
‘2015-05-13 21:55:00’, ‘2015-05-13 21:40:00’,
…
‘2003-01-06 02:00:00’, ‘2003-01-06 01:54:00’,
‘2003-01-06 01:50:00’, ‘2003-01-06 01:36:00’,
‘2003-01-06 00:55:00’, ‘2003-01-06 00:40:00’,
‘2003-01-06 00:33:00’, ‘2003-01-06 00:31:00’,
‘2003-01-06 00:20:00’, ‘2003-01-06 00:01:00’],
dtype=’datetime64[ns]’, name=’date’, length=306742, freq=None)
df2 = ddf.resample('m',how='sum')#按月求和plt.style.use('ggplot')
moav = df2.rolling(12).mean()#每12个月统计平均,相当于加了个窗
i = 1
for cat in df2.columns:
plt.figure(figsize=(12,15))
ax = plt.subplot(6,1,i)
plt.plot(df2.index,df2[cat])
plt.plot(df2.index,moav[cat])
plt.title(cat)
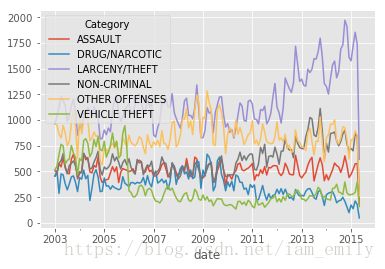
i+=1df2.plot()可见,不同种类的案件随时间是有不同变化的,如vehicle theft在05年后急剧下降,可能有专项整治等活动,theft却在12年后有升高的趋势。
地图坐标展示
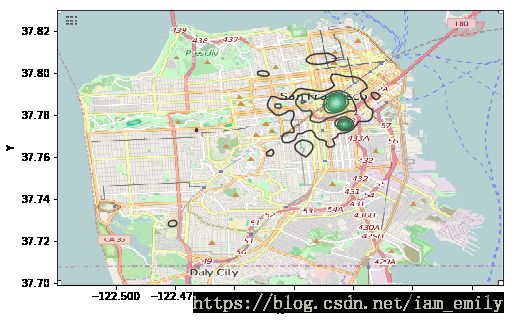
在给的训练和测试数据最后,有2列是代表犯罪案件发生的经纬度坐标,从上面分析知道有些地区是案件高发区,有些地区某类案件比例较高,所以可知,地理位置和案件分类有较强的关系,我们以地图的形式展示某些案件的高发地区。
train[['X','Y']].describe()| X | Y | |
|---|---|---|
| count | 878049.000000 | 878049.000000 |
| mean | -122.422616 | 37.771020 |
| std | 0.030354 | 0.456893 |
| min | -122.513642 | 37.707879 |
| 25% | -122.432952 | 37.752427 |
| 50% | -122.416420 | 37.775421 |
| 75% | -122.406959 | 37.784369 |
| max | -120.500000 | 90.000000 |
#show SF map
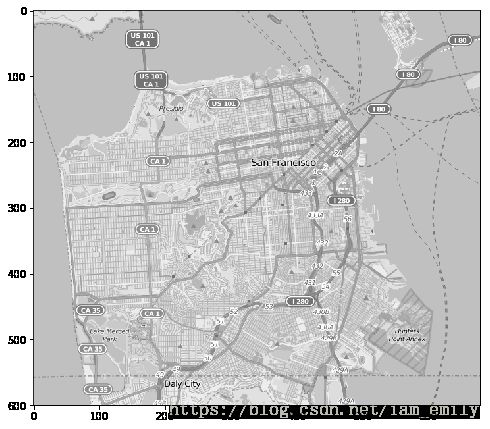
mapdata = np.loadtxt('sf_map_copyright_openstreetmap_contributors.txt')
plt.figure(figsize=(8,8))
plt.imshow(mapdata,cmap=plt.get_cmap('gray'))
plt.show()
#我们选取数量最多的偷盗类案件
theft=train[train['Category']=='LARCENY/THEFT']#我的电脑用所有训练数据画图时,时间特别长,所以这里选取部分数据,并去除可能不正确的数据
#theft['Xok'] = theft[theft.X<-121].X
#theft['Yok'] = theft[theft.Y>40].Y
theft = theft[1:300000]asp = mapdata.shape[0]*1.0/mapdata.shape[1]
lon_lat_box = (-122.5247, -122.3366, 37.699, 37.8299)
clipsize = [[-122.5247, -122.3366],[ 37.699, 37.8299]]
plt.figure(figsize=(8,8*asp))
ax = sns.kdeplot(theft.X,theft.Y,clip=clipsize,aspect=1/asp)
#ax = sns.regplot('X', 'Y', data=theft, fit_reg=False)
ax.imshow(mapdata,cmap=plt.get_cmap('gray'),extent=lon_lat_box,aspect=asp)
im = plt.imread('SanFranMap.png')
plt.figure(figsize=(8,8))
ax = sns.kdeplot(theft.X,theft.Y,clip=clipsize,aspect=1/asp)
#ax = sns.regplot('X', 'Y', data=theft, fit_reg=False)
ax.imshow(im,cmap=plt.get_cmap('gray'),extent=lon_lat_box,aspect=asp)
因为只是在一个city,可以看出XY(经纬坐标)范围很小,数值型数据再经过标准化处理后,其指示的地域范围就很模糊了,分类效果不明显,但地理位置对案件类型还是有影响的,我们暂且选用PdDistrict。
数据处理
类别特征:Dates,Descript,DayOfWeek,PdDistrict,Resolution,Address
数值型特征:X,Y,year,month,day,hour
时间特征:date
from sklearn import preprocessing
from sklearn.preprocessing import MinMaxScaler
from sklearn.cross_validation import train_test_split
#from sklearn.feature_selection import SelectKBest
#from sklearn.feature_selection import chi2
from sklearn.cross_validation import train_test_split
D:\programs\anaconda\lib\site-packages\sklearn\cross_validation.py:41: DeprecationWarning: This module was deprecated in version 0.18 in favor of the model_selection module into which all the refactored classes and functions are moved. Also note that the interface of the new CV iterators are different from that of this module. This module will be removed in 0.20.
"This module will be removed in 0.20.", DeprecationWarning)
#对测试集的Dates做同样的处理
test['date'] = pd.to_datetime(test['Dates'])
test['year'] = test.date.dt.year
test['month'] = test.date.dt.month
test['day'] = test.date.dt.day
test['hour'] = test.date.dt.hour
test.info()
RangeIndex: 884262 entries, 0 to 884261
Data columns (total 12 columns):
Id            884262 non-null int64
Dates         884262 non-null object
DayOfWeek     884262 non-null object
PdDistrict    884262 non-null object
Address       884262 non-null object
X             884262 non-null float64
Y             884262 non-null float64
date          884262 non-null datetime64[ns]
year          884262 non-null int64
month         884262 non-null int64
day           884262 non-null int64
hour          884262 non-null int64
dtypes: datetime64[ns](1), float64(2), int64(5), object(4)
memory usage: 81.0+ MB
train.info()
RangeIndex: 878049 entries, 0 to 878048
Data columns (total 14 columns):
Dates         878049 non-null object
Category      878049 non-null object
Descript      878049 non-null object
DayOfWeek     878049 non-null object
PdDistrict    878049 non-null object
Resolution    878049 non-null object
Address       878049 non-null object
X             878049 non-null float64
Y             878049 non-null float64
date          878049 non-null datetime64[ns]
year          878049 non-null int64
month         878049 non-null int64
day           878049 non-null int64
hour          878049 non-null int64
dtypes: datetime64[ns](1), float64(2), int64(4), object(7)
memory usage: 93.8+ MB
预测类别标签
#对分类目标做标签化处理

label = preprocessing.LabelEncoder()
target = label.fit_transform(train.Category)
target
array([37, 21, 21, ..., 16, 35, 12], dtype=int64)
#处理不统一的特征
Id = test['Id']
des = train['Descript']
res = train['Resolution']
train.drop(['Category','Descript','Resolution'],axis=1,inplace=True)
test.drop('Id',axis=1,inplace=True)
#合并数据方便处理
full = pd.concat([train,test],keys=['train','test'])full.info()
MultiIndex: 1762311 entries, (train, 0) to (test, 884261)
Data columns (total 11 columns):
Dates         object
DayOfWeek     object
PdDistrict    object
Address       object
X             float64
Y             float64
date          datetime64[ns]
year          int64
month         int64
day           int64
hour          int64
dtypes: datetime64[ns](1), float64(2), int64(4), object(4)
memory usage: 163.0+ MB
选取特征
#对DayOfWeek做one-hot编码转为数值型
week = pd.get_dummies(full.DayOfWeek)
#PdDistrict和Address重复
#选择PdDistrict并做处理
full.drop('Address',axis=1,inplace=True)
dist = pd.get_dummies(full.PdDistrict)#时间特征
#删除重复的Dates,date
full.drop(['Dates','date'],axis=1,inplace=True)对数值型时间特征year month day hour,不同类型案件的year趋势不一样,month特征在年初会有不同,hour特征在18点后会有不同,所以添加2个新特征newy,dark.
full['newy'] = full['month'].apply(lambda x:1 if x==1 or x==2 else 0)
full['dark'] = full['hour'].apply(lambda x:1 if x>=18 and x<=24 else 0)
hour_dum = pd.get_dummies(full.hour)year_dum = pd.get_dummies(full.year)month_dum = pd.get_dummies(full.month)
#删除、合并特征
full.drop(['month','hour','day','year','DayOfWeek','PdDistrict'],axis=1,inplace=True)

#full = pd.concat(['week','dist','year'],axis=1)
#full.drop('year',axis=1,inplace=True)
full = pd.concat([full,week,dist,year_dum,month_dum,hour_dum,],axis=1)
#full.drop(['month','hour','day','year','DayOfWeek','PdDistrict'],axis=1,inplace=True)
#full = pd.concat([full,week,dist,year_dum,hour_dum,month_dum],axis=1)full.isnull().sum()newy 0
dark 0
Friday 0
Monday 0
Saturday 0
Sunday 0
Thursday 0
Tuesday 0
Wednesday 0
BAYVIEW 0
CENTRAL 0
INGLESIDE 0
MISSION 0
NORTHERN 0
PARK 0
RICHMOND 0
SOUTHERN 0
TARAVAL 0
TENDERLOIN 0
2003 0
2004 0
2005 0
2006 0
2007 0
2008 0
2009 0
2010 0
2011 0
..
7 0
8 0
9 0
10 0
11 0
12 0
0 0
1 0
2 0
3 0
4 0
5 0
6 0
7 0
8 0
9 0
10 0
11 0
12 0
13 0
14 0
15 0
16 0
17 0
18 0
19 0
20 0
21 0
22 0
23 0
Length: 70, dtype: int64
生成验证集、测试集
#加入所有特征
training,valid,y_train,y_valid = train_test_split(full[:train.shape[0]],target,train_size=0.7,random_state=0)training.shape(614634, 68)
model
from sklearn.linear_model import LogisticRegression
from sklearn.metrics import log_loss
from sklearn.naive_bayes import BernoulliNB
import timetraining.shape(614634, 68)
逻辑回归
LR = LogisticRegression(C=0.1)
lrstart = time.time()
LR.fit(training, y_train)
lrcost_time = time.time()-lrstart
predicted = np.array(LR.predict_proba(valid))
print("逻辑回归log损失为 %f" %(log_loss(y_valid, predicted)))
print('逻辑回归建模耗时 %f 秒' %(lrcost_time))
逻辑回归log损失为 2.596991
逻辑回归建模耗时 130.701451 秒
朴素贝叶斯
NB = BernoulliNB()
nbstart = time.time()
NB.fit(training,y_train)
nbcost_time = time.time()-nbstart
predicted = np.array(NB.predict_proba(valid))
print("贝叶斯log损失为 %f" %(log_loss(y_valid, predicted)))
print( "朴素贝叶斯建模耗时 %f 秒" %(nbcost_time))
贝叶斯log损失为 2.607965
朴素贝叶斯建模耗时 1.765910 秒
train_all = np.c_[training,y_train]
train_all.shape
(614634, 69)
np.savetxt('/forBP/train.csv',train_all,fmt='%d',delimiter=',')随机森林
from sklearn.ensemble import RandomForestClassifier

params = [12,13,14,15,16]
for par in params:
    clf = RandomForestClassifier(n_estimators=30, max_depth=par)
#forest_start = time.time()
    clf.fit(training,y_train)
#fcost = time.time()-forest_start
    predicted = np.array(clf.predict_proba(valid))
    print("随机森林log损失为 %f" %(log_loss(y_valid, predicted)))
#print( "随机森林建模耗时 %f 秒" %(fcost))
随机森林log损失为 2.575974
随机森林log损失为 2.568528
随机森林log损失为 2.563786
随机森林log损失为 2.559156
随机森林log损失为 2.555832
#write the result
result = NB.predict_proba(full[train.shape[0]:])
submission = pd.DataFrame(result,columns=label.classes_)
submission.to_csv('SFresult_v1.csv',index = False, index_label='Id' )submission.shape(884262, 39)
这里使用了逻辑回归、贝叶斯分类和随机森林,目标损失函数是log loss,贝叶斯分类时间快,精确度也较高,使用集成学习器后能大大提高准确度,所以下一步可以考虑使用不同的集成学习器,或者对随机森林的参数进行调优。
我这里选择的特征方式比较简单,包含时间和低点,都是非数值型特征,只是简单做了onehot编码,下一步可以考虑加入PCA进行降维,或者重新选择和构造新特征。对于文本特征discription,这里没有使用,可以借助这个特征进行文本分类预测,或者通过分析关键词,对other offense类案件有更清晰的了解。
虽然样板数量较之前的比赛有了提升,但特征量并不算多,下一步我考虑使用TensorFlow对处理好的数据进行BP神经网络预测。
新手学习,欢迎指教!!!


