某酒店预定需求分析
分析流程
1. 了解数据信息
使用pandas_profiling中的profilereport能够得到关于数据的概览;
import pandas_profiling

file_path = "F:/jupyter/kaggle/数据集/1、Hotel booking demand酒店预订需求\hotel_booking_demand.csv"
hb_df = pd.read_csv(file_path)

# hb_df.profile_report()
pandas_profiling.ProfileReport(hb_df)
| 分析方向 |
|---|
| 酒店运营情况——取消数、入住率、人均每晚房间价格、不同月份人均每晚价格 |
| 旅客情况——来自国家、餐食选择情况、居住时长、提前预定时长 |
| 预定渠道情况——不同市场细分下的价格 |
2. 数据清洗
2.1 缺失值
hb_df.isnull().sum()[hb_df.isnull().sum()!=0]
确定含缺失值的字段
输出:
children         4
country        488
agent        16340
company     112593
处理:
| 处理方法 |
|---|
| 假设agent中缺失值代表未指定任何机构,即nan=0 |
| country则直接使用其字段内众数填充 |
| childred使用其字段内众数填充 |
| company因缺失数值过大,且其信息较杂(单个值分布太多),所以直接删除 |
代码如下:
hb_new = hb_df.copy(deep=True)
hb_new.drop("company", axis=1, inplace=True)

hb_new["agent"].fillna(0, inplace=True)
hb_new["children"].fillna(hb_new["children"].mode()[0], inplace=True)
hb_new["country"].fillna(hb_new["country"].mode()[0], inplace=True)
2.2 异常值
此数据集中异常值为那些总人数(adults+children+babies)为0的记录,同时,因为先前已指名“meal”中“SC”和“Undefined”为同一类别,因此也许处理一下。
代码如下:
hb_new["children"] = hb_new["children"].astype(int)
hb_new["agent"] = hb_new["agent"].astype(int)

hb_new["meal"].replace("Undefined", "SC", inplace=True)
# 处理异常值
# 将 变量 adults + children + babies == 0 的数据删除
zero_guests = list(hb_new["adults"] +
                  hb_new["children"] +
                  hb_new["babies"] == 0)
# hb_new.info()
hb_new.drop(hb_new.index[zero_guests], inplace=True)
此时数据基本已经没有问题,可以开始结合可视化的探索性分析了。
3. 探索性分析(+可视化)
3.1 酒店运营方面
3.1.1 取消数、入住率
plt.rcParams["font.sans-serif"] = ["SimHei"]
plt.rcParams["font.serif"] = ["SimHei"]
# 从预定是否取消考虑
rh_iscancel_count = hb_new[hb_new["hotel"]=="Resort Hotel"].groupby(["is_canceled"])["is_canceled"].count()
ch_iscancel_count = hb_new[hb_new["hotel"]=="City Hotel"].groupby(["is_canceled"])["is_canceled"].count()

rh_cancel_data = pd.DataFrame({"hotel": "度假酒店",
                              "is_canceled": rh_iscancel_count.index,
                              "count": rh_iscancel_count.values})

ch_cancel_data = pd.DataFrame({"hotel": "城市酒店",
                              "is_canceled": ch_iscancel_count.index,
                              "count": ch_iscancel_count.values})
iscancel_data = pd.concat([rh_cancel_data, ch_cancel_data], ignore_index=True)

plt.figure(figsize=(12, 8))
w, t, autotexts = plt.pie(hb_new["hotel"].value_counts(), autopct="%.2f%%",textprops={"fontsize":18})
plt.title("酒店总预定数分布", fontsize=16)
plt.legend(w, (iscancel_data.loc[iscancel_data.is_canceled==1, "hotel"].value_counts().index)[::-1], loc="upper right",
          fontsize=14)
# plt.savefig("F:/文章/酒店总预定数分布.png")
plt.show();
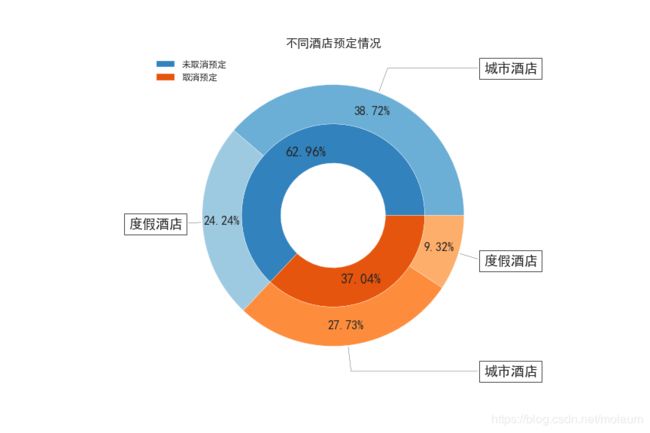
此为获得图形:
plt.figure(figsize=(12, 8))

cmap = plt.get_cmap("tab20c")
outer_colors = cmap(np.arange(2)*4)
inner_colors = cmap(np.array([1, 2, 5, 6]))

w , t, at = plt.pie(hb_new["is_canceled"].value_counts(), autopct="%.2f%%",textprops={"fontsize":18},
                   radius=0.7, wedgeprops=dict(width=0.3), pctdistance=0.75, colors=outer_colors)
plt.legend(w, ["未取消预定", "取消预定"], loc="upper right", bbox_to_anchor=(0, 0, 0.2, 1), fontsize=12)


val_array = np.array((iscancel_data.loc[(iscancel_data.hotel=="城市酒店")&(iscancel_data.is_canceled==0), "count"].values,
       iscancel_data.loc[(iscancel_data.hotel=="度假酒店")&(iscancel_data.is_canceled==0), "count"].values,
       iscancel_data.loc[(iscancel_data.hotel=="城市酒店")&(iscancel_data.is_canceled==1), "count"].values,
       iscancel_data.loc[(iscancel_data.hotel=="度假酒店")&(iscancel_data.is_canceled==1), "count"].values))

w2, t2, at2 = plt.pie(val_array, autopct="%.2f%%",textprops={"fontsize":16}, radius=1,
       wedgeprops=dict(width=0.3), pctdistance=0.85, colors=inner_colors)
plt.title("不同酒店预定情况", fontsize=16)

bbox_props = dict(boxstyle="square,pad=0.3", fc="w", ec="k", lw=0.72)
kw = dict(arrowprops=dict(arrowstyle="-", color="k"), bbox=bbox_props, zorder=3, va="center")
for i, p in enumerate(w2):
#     print(i, p, sep="---")
    text = ["城市酒店", "度假酒店", "城市酒店", "度假酒店"]
    ang = (p.theta2 - p.theta1) / 2. + p.theta1
    y = np.sin(np.deg2rad(ang))
    x = np.cos(np.deg2rad(ang))
    horizontalalignment = {-1: "right", 1: "left"}[int(np.sign(x))]
    connectionstyle = "angle, angleA=0, angleB={}".format(ang)
    kw["arrowprops"].update({"connectionstyle": connectionstyle})
    plt.annotate(text[i], xy=(x, y), xytext=(1.15*np.sign(x), 1.2*y),
                horizontalalignment=horizontalalignment, **kw, fontsize=18)
可以看到,城市酒店的预定数要大于度假酒店,但城市酒店的取消率也相对较高。
3.1.2 酒店人均价格
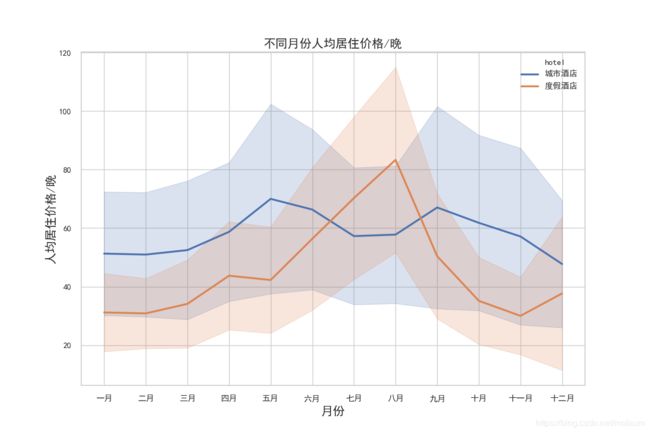
接下来可以从人均价格入手,看看两家酒店的运营情况。
因为babies年龄过小,所以人均价格中未将babies带入计算。
人 均 价 格 / 晚 = a d r a d u l t s + c h i l d r e n 人均价格/晚 = \frac{adr}{adults+children} 人均价格/晚=adults+childrenadr
此时来查看不同月份下的平均酒店价格,代码如下:
# 从月份上看人均平均每晚价格

room_price_monthly = full_data_guests[["hotel", "arrival_date_month", "adr_pp"]].sort_values("arrival_date_month")

ordered_months = ["January", "February", "March", "April", "May", "June", "July", "August",
                 "September", "October", "November", "December"]
month_che = ["一月", "二月", "三月", "四月", "五月", "六月", "七月", "八月", "九月", "十月", "十一月", "十二月", ]

for en, che in zip(ordered_months, month_che):
    room_price_monthly["arrival_date_month"].replace(en, che, inplace=True)
room_price_monthly["arrival_date_month"] = pd.Categorical(room_price_monthly["arrival_date_month"],
                                                         categories=month_che, ordered=True)
room_price_monthly["hotel"].replace("City Hotel", "城市酒店", inplace=True)
room_price_monthly["hotel"].replace("Resort Hotel", "度假酒店", inplace=True)
room_price_monthly.head(15)

plt.figure(figsize=(12, 8))
sns.lineplot(x="arrival_date_month", y="adr_pp", hue="hotel", data=room_price_monthly,
            hue_order=["城市酒店", "度假酒店"], ci="sd", size="hotel", sizes=(2.5, 2.5))
plt.title("不同月份人均居住价格/晚", fontsize=16)
plt.xlabel("月份", fontsize=16)
plt.ylabel("人均居住价格/晚", fontsize=16)
# plt.savefig("F:/文章/不同月份人均居住价格每晚")
同时,我认为结合15-17年内平均人流量(即未取消预定下的不同月份的预定数),会有一个更加清晰的认识:
注意:因为求的是均值,所以最后绘图前需要把不同月份的总预定数除以此月份的计数(15-17年这个月份出现过几次)。
# 查看月度人流量
rh_bookings_monthly = full_data_guests[full_data_guests.hotel=="Resort Hotel"].groupby("arrival_date_month")["hotel"].count()
ch_bookings_monthly = full_data_guests[full_data_guests.hotel=="City Hotel"].groupby("arrival_date_month")["hotel"].count()

rh_bookings_data = pd.DataFrame({"arrival_date_month": list(rh_bookings_monthly.index),
                                "hotel": "度假酒店",
                                "guests": list(rh_bookings_monthly.values)})
ch_bookings_data = pd.DataFrame({"arrival_date_month": list(ch_bookings_monthly.index),
                                "hotel": "城市酒店",
                                "guests": list(ch_bookings_monthly.values)})
full_booking_monthly_data = pd.concat([rh_bookings_data, ch_bookings_data], ignore_index=True)

ordered_months = ["January", "February", "March", "April", "May", "June", "July", "August",
                 "September", "October", "November", "December"]
month_che = ["一月", "二月", "三月", "四月", "五月", "六月", "七月", "八月", "九月", "十月", "十一月", "十二月"]

for en, che in zip(ordered_months, month_che):
    full_booking_monthly_data["arrival_date_month"].replace(en, che, inplace=True)

full_booking_monthly_data["arrival_date_month"] = pd.Categorical(full_booking_monthly_data["arrival_date_month"],
                                                      categories=month_che, ordered=True)

full_booking_monthly_data.loc[(full_booking_monthly_data["arrival_date_month"]=="七月")|\
                             (full_booking_monthly_data["arrival_date_month"]=="八月"), "guests"] /= 3
full_booking_monthly_data.loc[~((full_booking_monthly_data["arrival_date_month"]=="七月")|\
                             (full_booking_monthly_data["arrival_date_month"]=="八月")), "guests"] /= 2
plt.figure(figsize=(12, 8))
sns.lineplot(x="arrival_date_month",
            y="guests",
            hue="hotel", hue_order=["城市酒店", "度假酒店"],
            data=full_booking_monthly_data, size="hotel", sizes=(2.5, 2.5))
plt.title("不同月份平均旅客数", fontsize=16)
plt.xlabel("月份", fontsize=16)
plt.ylabel("旅客数", fontsize=16)
# plt.savefig("F:/文章/不同月份平均旅客数")
得到图形:
结合上述两幅图可以了解到:
- 在春秋两季城市酒店价格虽然高,但其入住人数一点也没降低,反而处于旺季;
- 而度假酒店在6-9月份游客数本身就偏低,可这个时间段内的价格却在持续上升,远高于其他月份;
- 不论是城市酒店还是度假酒店,冬季的生意都不是特别好。
3.2 游客简易画像
3.2.1 游客分布
可以简单了解一下选择这两家酒店入住的旅客都来自于哪些国家。
这次使用了plotly中的一个map图形,有一定交互性,便于查看。
map = px.choropleth(country_data, locations="country", color="总游客数", hover_name="country",
                          color_continuous_scale=px.colors.sequential.Plasma,
                         title="游客分布")
map.show()
可以明显看到游客主要还是集中在欧洲地区。
3.2.2 餐食选择
现在我们可以了解以下对餐食的选择是否会影响游客取消预定这一行为。
meal_data = hb_new[["hotel", "is_canceled", "meal"]]
# meal_data

plt.figure(figsize=(12, 8))
plt.subplot(121)
plt.pie(meal_data.loc[meal_data["is_canceled"]==0, "meal"].value_counts(),
        labels=meal_data.loc[meal_data["is_canceled"]==0, "meal"].value_counts().index,
       autopct="%.2f%%")
plt.title("未取消预订旅客餐食选择", fontsize=16)
plt.legend(loc="upper right")

plt.subplot(122)
plt.pie(meal_data.loc[meal_data["is_canceled"]==1, "meal"].value_counts(),
        labels=meal_data.loc[meal_data["is_canceled"]==1, "meal"].value_counts().index,
       autopct="%.2f%%")
plt.title("取消预订旅客餐食选择", fontsize=16)
plt.legend(loc="upper right")
很明显,取消预订旅客和未取消预订旅客有基本相同的餐食选择。
我们不能因为一位游客bed&breakfast选择的是就说他一定会取消预定,我们赶紧不要管他;或者说他一定不会取消预订,这位客人很重要。
3.2.3 居住时长
那么在不同酒店居住的旅客通常会选择住几天呢?我们可以使用柱形图来看一下其时长的不同分布;
首先计算出总时长:总时长=周末停留夜晚数+工作日停留夜晚数
full_data_guests["total_nights"] = full_data_guests["stays_in_weekend_nights"] + full_data_guests["stays_in_week_nights"]
因为居住时长独立值过多,所以我新建一个变量来将其变为分类型数据:
# 新建字段:total_nights_bin——居住时长区间
full_data_guests["total_nights_bin"] = "住1晚"
full_data_guests.loc[(full_data_guests["total_nights"]>1)&(full_data_guests["total_nights"]<=5), "total_nights_bin"] = "2-5晚"
full_data_guests.loc[(full_data_guests["total_nights"]>5)&(full_data_guests["total_nights"]<=10), "total_nights_bin"] = "6-10晚"
full_data_guests.loc[(full_data_guests["total_nights"]>10), "total_nights_bin"] = "11晚以上"
此时,再来绘图:
ch_nights_count = full_data_guests["total_nights_bin"][full_data_guests.hotel=="City Hotel"].value_counts()
rh_nights_count = full_data_guests["total_nights_bin"][full_data_guests.hotel=="Resort Hotel"].value_counts()

ch_nights_index = full_data_guests["total_nights_bin"][full_data_guests.hotel=="City Hotel"].value_counts().index
rh_nights_index = full_data_guests["total_nights_bin"][full_data_guests.hotel=="Resort Hotel"].value_counts().index

ch_nights_data = pd.DataFrame({"hotel": "城市酒店",
                               "nights": ch_nights_index,
                              "guests": ch_nights_count})
rh_nights_data = pd.DataFrame({"hotel": "度假酒店",
                               "nights": rh_nights_index,
                              "guests": rh_nights_count})
# 绘图数据
nights_data = pd.concat([ch_nights_data, rh_nights_data], ignore_index=True)
order = ["住1晚", "2-5晚", "6-10晚", "11晚以上"]
nights_data["nights"] = pd.Categorical(nights_data["nights"], categories=order, ordered=True)

plt.figure(figsize=(12, 8))
sns.barplot(x="nights", y="guests", hue="hotel", data=nights_data)
plt.title("旅客居住时长分布", fontsize=16)
plt.xlabel("居住时长", fontsize=16)
plt.ylabel("旅客数", fontsize=16)

plt.legend()
输出:
不论哪家游客基本选择都在1-5晚,而其中度假酒店中的旅客还有另外一种选择——6-10晚。
3.2.4 提前预定时长
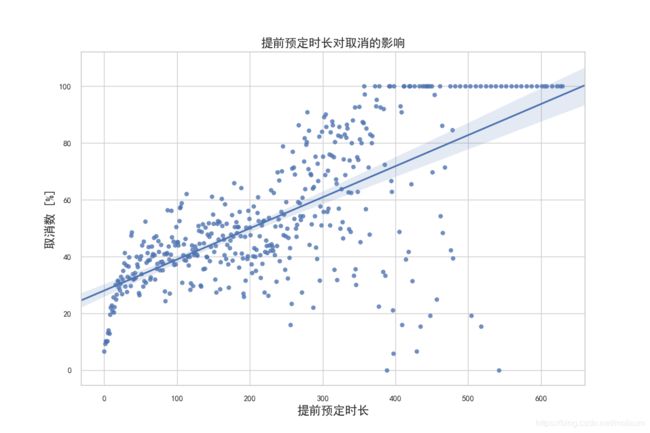
提前预定期对旅客是否选择取消预订也有很大影响,因为lead_time字段中的值分布多且散乱,所以使用散点图比较合适,同时还可以绘制一条回归线。
lead_cancel_data = pd.DataFrame(hb_new.groupby("lead_time")["is_canceled"].describe())
# lead_cancel_data
# 因为lead_time中值范围大且数量分布不匀,所以选取lead_time>10次的数据(<10的数据不具代表性)
lead_cancel_data_10 = lead_cancel_data[lead_cancel_data["count"]>10]

y = list(round(lead_cancel_data_10["mean"], 4) * 100)

plt.figure(figsize=(12, 8))
sns.regplot(x=list(lead_cancel_data_10.index),
           y=y)
plt.title("提前预定时长对取消的影响", fontsize=16)
plt.xlabel("提前预定时长", fontsize=16)
plt.ylabel("取消数 [%]", fontsize=16)
# plt.savefig("F:/文章/提前预定时长对取消的影响")
输出:
可以明显看到:不同的提前预定时长确定对旅客是否取消预定有一定影响;
通常,离入住日期越早约定,越不容易取消酒店房间预定。
3.3 市场细分
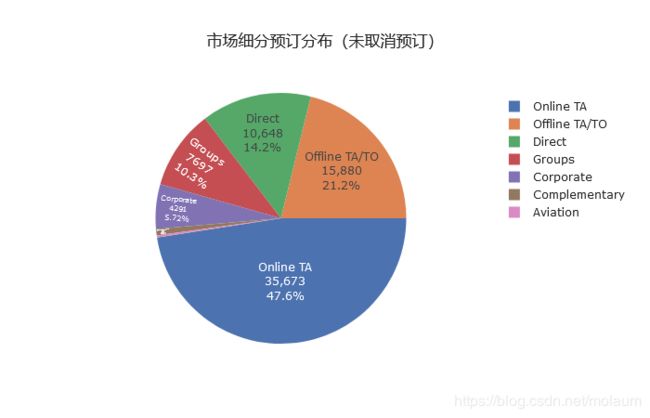
最后还可以查看以下不同市场细分下的预定分布情况。
segment_count = list(full_data_guests["market_segment"].value_counts())
segment_ls = list(full_data_guests["market_segment"].value_counts().index)

# 查看市场细分分布
plt.figure(figsize=(12, 8))
fig = px.pie(values=segment_count, names=segment_ls, title="市场细分预订分布(未取消预订)", template="seaborn")
fig.update_traces(rotation=90, textposition="inside", textinfo="label+percent+value")
还可以查看一下,通过不同的市场预定两家酒店的价格有何不同。
# 不同市场细分下的人均价格每晚
plt.figure(figsize=(6, 8))
# plt.subplot(121)
sns.barplot(x="market_segment",
           y="adr_pp",
           hue="hotel",
           data=hb_new, ci="sd", errwidth=1, capsize=0.1, hue_order=["City Hotel", "Resort Hotel"])
plt.title("不同市场细分下人均每晚价格", fontsize=16)
plt.xlabel("市场细分", fontsize=16)
plt.ylabel("人均每晚价格", fontsize=16)
plt.xticks(rotation=45)
plt.legend(loc="upper left", facecolor="white", edgecolor="k", frameon=True)
可以看到,人们大多通过线上旅行社完成预定,既因为其便捷性,也因为其价格合理;
而航空公司的价格则很高,同时通过其预定的人数也最少。
4. 做出结论
从以上三个维度的分析中可以看到:
- 度假酒店在6-9月份预定数偏少时其价格较同年的其他月份都要高,建议可以适当降低一些;城市酒店在春秋两季的房间价格最高,可此时预定数也最多,但在7、8月份预定数急速下降,虽然此时房间价格也降下来了,明显价格的降低并没有吸引住旅客;
- 离入住日期越近的旅客越有可能入住,同时,在这两家酒店的周边国家的旅客也更不可能取消预定;
- 线上旅行社是人们与家人朋友出行的首选。
上述分析数据来自kaggle——酒店预定需求;
有更好的角度分析的,欢迎大家来讨论。
(部分图形代码参考自https://www.kaggle.com/marcuswingen/eda-of-bookings-and-ml-to-predict-cancelations)
欢迎关注微信,一起学习!


