MT5入门到精通之十指标
(代码编译后最好卸载指标,再重新加载一遍,有时候颜色会怪怪的)
1,界面后设置操作
我们就画一根线效果如下:
1.第一方法 先序列号 (和mt4一样,最新那根k线下标为0)
//+------------------------------------------------------------------+
//|                                                testIndicator.mq5 |
//|                        Copyright 2017, MetaQuotes Software Corp. |
//|                                             https://www.mql5.com |
//+------------------------------------------------------------------+
#property copyright "Copyright 2017, MetaQuotes Software Corp."
#property link      "https://www.mql5.com"
#property version   "1.00"
//辅图显示
#property indicator_chart_window
#property indicator_minimum -100
#property indicator_maximum 100
//总共需要几个缓存数组
#property indicator_buffers 3
//几种图形
#property indicator_plots   3
//--- plot line
#property indicator_label1  "line"
#property indicator_type1   DRAW_LINE
#property indicator_color1  clrRed
#property indicator_style1  STYLE_SOLID
#property indicator_width1  1
//--- plot arrow
#property indicator_label2  "arrow"
#property indicator_type2   DRAW_ARROW
#property indicator_color2  clrYellow
#property indicator_style2  STYLE_SOLID
#property indicator_width2  1
//--- plot histogram
#property indicator_label3  "histogram"
#property indicator_type3   DRAW_HISTOGRAM
#property indicator_color3  clrRed
#property indicator_style3  STYLE_SOLID
#property indicator_width3  1
//--- indicator buffers
double         lineBuffer[];
double         arrowBuffer[];
double         histogramBuffer[];
//+------------------------------------------------------------------+
//| Custom indicator initialization function                         |
//+------------------------------------------------------------------+
int OnInit()
  {
//--- indicator buffers mapping
   SetIndexBuffer(0,lineBuffer,INDICATOR_DATA);
   SetIndexBuffer(1,arrowBuffer,INDICATOR_DATA);
   SetIndexBuffer(2,histogramBuffer,INDICATOR_DATA);
//--- setting a code from the Wingdings charset as the property of PLOT_ARROW
   PlotIndexSetInteger(1,PLOT_ARROW,159);

//1.保证k线图最右边那根k线下标是0(和mt4一致)
   ArraySetAsSeries(lineBuffer,true);
//---
   return(INIT_SUCCEEDED);
  }
//+------------------------------------------------------------------+
//| Custom indicator iteration function                              |
//+------------------------------------------------------------------+
int OnCalculate(const int rates_total,
                const int prev_calculated,
                const datetime &time[],
                const double &open[],
                const double &high[],
                const double &low[],
                const double &close[],
                const long &tick_volume[],
                const long &volume[],
                const int &spread[])
  {
//3.接口返回的数组正序华
   setSystemReturnArrayAsSeries(time,open,high,low,close,tick_volume,volume,spread);

//2.设置缓存数据的数组
//lineBuffer[0] = 90;
//lineBuffer[1] = 30;

//2.1 //首次加载prev_calculated = 0,
//加1是为了多计算一根k线【一般只会有新k线出来的时候,才会多计算一根】
   int limit=(prev_calculated>0) ?(rates_total-prev_calculated+1) : 0;

   for(int i=0;i
2.方法2(MT5自带的序列方法,最新那根x下标是rates_total-1)
//+------------------------------------------------------------------+
//|                                                testIndicator.mq5 |
//|                        Copyright 2017, MetaQuotes Software Corp. |
//|                                             https://www.mql5.com |
//+------------------------------------------------------------------+
#property copyright "Copyright 2017, MetaQuotes Software Corp."
#property link      "https://www.mql5.com"
#property version   "1.00"
//辅图显示
#property indicator_chart_window
#property indicator_minimum -100
#property indicator_maximum 100
//总共需要几个缓存数组
#property indicator_buffers 3
//几种图形
#property indicator_plots   3
//--- plot line
#property indicator_label1  "line"
#property indicator_type1   DRAW_LINE
#property indicator_color1  clrRed
#property indicator_style1  STYLE_SOLID
#property indicator_width1  1
//--- plot arrow
#property indicator_label2  "arrow"
#property indicator_type2   DRAW_ARROW
#property indicator_color2  clrYellow
#property indicator_style2  STYLE_SOLID
#property indicator_width2  1
//--- plot histogram
#property indicator_label3  "histogram"
#property indicator_type3   DRAW_HISTOGRAM
#property indicator_color3  clrRed
#property indicator_style3  STYLE_SOLID
#property indicator_width3  1
//--- indicator buffers
double         lineBuffer[];
double         arrowBuffer[];
double         histogramBuffer[];
//+------------------------------------------------------------------+
//| Custom indicator initialization function                         |
//+------------------------------------------------------------------+
int OnInit()
  {
//--- indicator buffers mapping
   SetIndexBuffer(0,lineBuffer,INDICATOR_DATA);
   SetIndexBuffer(1,arrowBuffer,INDICATOR_DATA);
   SetIndexBuffer(2,histogramBuffer,INDICATOR_DATA);
//--- setting a code from the Wingdings charset as the property of PLOT_ARROW
   PlotIndexSetInteger(1,PLOT_ARROW,159);

   return(INIT_SUCCEEDED);
  }
//+------------------------------------------------------------------+
//| Custom indicator iteration function                              |
//+------------------------------------------------------------------+
int OnCalculate(const int rates_total,
                const int prev_calculated,
                const datetime &time[],
                const double &open[],
                const double &high[],
                const double &low[],
                const double &close[],
                const long &tick_volume[],
                const long &volume[],
                const int &spread[])
  {
  //多计算一根 【一般只会有新k线出来的时候,才会多计算一根】
   int start= (prev_calculated>0)? prev_calculated-1:0;
   for(int i=start;i
3.第三种方法 (在指标接口里获取其它指标的数据 1-3知识点即可)【指标里面使用其它指标也是这样用】
//+------------------------------------------------------------------+
//|                                                testIndicator.mq5 |
//|                        Copyright 2017, MetaQuotes Software Corp. |
//|                                             https://www.mql5.com |
//+------------------------------------------------------------------+
#property copyright "Copyright 2017, MetaQuotes Software Corp."
#property link      "https://www.mql5.com"
#property version   "1.00"
//辅图显示
#property indicator_separate_window
#property indicator_minimum -100
#property indicator_maximum 100
//总共需要几个缓存数组
#property indicator_buffers 3
//几种图形
#property indicator_plots   3
//--- plot line
#property indicator_label1  "line"
#property indicator_type1   DRAW_LINE
#property indicator_color1  clrRed
#property indicator_style1  STYLE_SOLID
#property indicator_width1  1
//--- plot arrow
#property indicator_label2  "arrow"
#property indicator_type2   DRAW_ARROW
#property indicator_color2  clrYellow
#property indicator_style2  STYLE_SOLID
#property indicator_width2  1
//--- plot histogram
#property indicator_label3  "histogram"
#property indicator_type3   DRAW_HISTOGRAM
#property indicator_color3  clrRed
#property indicator_style3  STYLE_SOLID
#property indicator_width3  1
//--- indicator buffers
double         lineBuffer[];
double         arrowBuffer[];
double         histogramBuffer[];

//1.句柄定义
int ma_h;
//+------------------------------------------------------------------+
//|                                                                  |
//+------------------------------------------------------------------+
int OnInit()
  {
//--- indicator buffers mapping
//6.会分配数组空间大小rates_total
   SetIndexBuffer(0,lineBuffer,INDICATOR_DATA);
   SetIndexBuffer(1,arrowBuffer,INDICATOR_DATA);
   SetIndexBuffer(2,histogramBuffer,INDICATOR_DATA);
//--- setting a code from the Wingdings charset as the property of PLOT_ARROW
//5.指标线的属性(单个指标设置)
//5.1箭头设置
   PlotIndexSetInteger(1,PLOT_ARROW,159);
//5.2线的颜色设置
   PlotIndexSetInteger(0,PLOT_LINE_COLOR,clrGold);

//4.设置指标的属性性(整个指标属性)
   IndicatorSetString(INDICATOR_SHORTNAME,"测试指标");
//4.1指标显示的位数
   IndicatorSetInteger(INDICATOR_DIGITS,Digits());

//2.句柄初始化值
   ma_h=iMA(Symbol(),0,10,0,MODE_SMA,PRICE_CLOSE);
   return(INIT_SUCCEEDED);
  }
//+------------------------------------------------------------------+
//| Custom indicator iteration function                              |
//+------------------------------------------------------------------+
int OnCalculate(const int rates_total,
                const int prev_calculated,
                const datetime &time[],
                const double &open[],
                const double &high[],
                const double &low[],
                const double &close[],
                const long &tick_volume[],
                const long &volume[],
                const int &spread[])
  {
//3.赋值到数据组
   CopyBuffer(ma_h,0,0,rates_total,lineBuffer);
   return(rates_total);
  }
//+------------------------------------------------------------------+
二.变色指标
1.效果
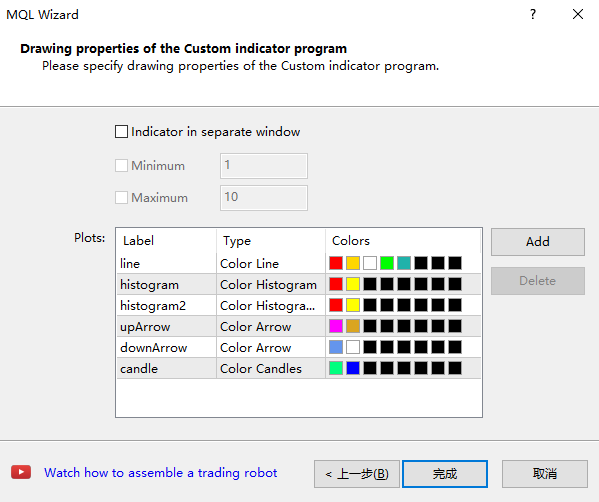
2.如下设置
3.实现
//+------------------------------------------------------------------+
//|                                         changeColorIndicator.mq5 |
//|                        Copyright 2017, MetaQuotes Software Corp. |
//|                                             https://www.mql5.com |
//+------------------------------------------------------------------+
#property copyright "Copyright 2017, MetaQuotes Software Corp."
#property link      "https://www.mql5.com"
#property version   "1.00"

#property indicator_chart_window
//1.1总共用到多少个缓存数组
#property indicator_buffers 18
//1.2画多少个图形
#property indicator_plots   7
//--- plot line
#property indicator_label1  "line"
#property indicator_type1   DRAW_COLOR_LINE
#property indicator_color1  clrRed,clrGold,clrWhite,clrLime,clrLightSeaGreen,C'0,0,0',C'0,0,0',C'0,0,0'
#property indicator_style1  STYLE_SOLID
#property indicator_width1  1
//--- plot histogram
#property indicator_label2  "histogram"
#property indicator_type2   DRAW_COLOR_HISTOGRAM
#property indicator_color2  clrRed,clrYellow,C'0,0,0',C'0,0,0',C'0,0,0',C'0,0,0',C'0,0,0',C'0,0,0'
#property indicator_style2  STYLE_SOLID
#property indicator_width2  1
//--- plot histogram2
#property indicator_label3  "histogram2"
#property indicator_type3   DRAW_COLOR_HISTOGRAM2
#property indicator_color3  clrRed,clrYellow,C'0,0,0',C'0,0,0',C'0,0,0',C'0,0,0',C'0,0,0',C'0,0,0'
#property indicator_style3  STYLE_SOLID
#property indicator_width3  3
//--- plot upArrow
#property indicator_label4  "upArrow"
#property indicator_type4   DRAW_COLOR_ARROW
#property indicator_color4  clrFuchsia,clrGoldenrod,C'0,0,0',C'0,0,0',C'0,0,0',C'0,0,0',C'0,0,0',C'0,0,0'
#property indicator_style4  STYLE_SOLID
#property indicator_width4  1
//--- plot downArrow
#property indicator_label5  "downArrow"
#property indicator_type5   DRAW_COLOR_ARROW
#property indicator_color5  clrCornflowerBlue,clrWhite,C'0,0,0',C'0,0,0',C'0,0,0',C'0,0,0',C'0,0,0',C'0,0,0'
#property indicator_style5  STYLE_SOLID
#property indicator_width5  1
//--- plot candle
#property indicator_label6  "candle"
#property indicator_type6   DRAW_COLOR_CANDLES
#property indicator_color6  clrSpringGreen,clrBlue,C'0,0,0',C'0,0,0',C'0,0,0',C'0,0,0',C'0,0,0',C'0,0,0'
#property indicator_style6  STYLE_SOLID
#property indicator_width6  1

#property indicator_label7  "line2"
#property indicator_type7   DRAW_COLOR_LINE
#property indicator_color7  clrRed,clrGold,clrWhite,clrLime,clrLightSeaGreen,C'0,0,0',C'0,0,0',C'0,0,0'
#property indicator_style7  STYLE_SOLID
#property indicator_width7  1
//--- indicator buffers
//line
double         lineBuffer[];
double         lineColors[];
//histogram
double         histogramBuffer[];
double         histogramColors[];
//histogram2
double         histogram2Buffer1[];
double         histogram2Buffer2[];
double         histogram2Colors[];
//upArrow
double         upArrowBuffer[];
double         upArrowColors[];
//downArrow
double         downArrowBuffer[];
double         downArrowColors[];
//candle
double         candleBuffer1[];
double         candleBuffer2[];
double         candleBuffer3[];
double         candleBuffer4[];
double         candleColors[];

//line2
double         line2Buffer[];
double         line2Colors[];

//2.1定义指标句柄
int ma5_h;
int ma10_h;
//+------------------------------------------------------------------+
//|                                                                  |
//+------------------------------------------------------------------+
int OnInit()
  {

   SetIndexBuffer(0,lineBuffer,INDICATOR_DATA);
   SetIndexBuffer(1,lineColors,INDICATOR_COLOR_INDEX);

   SetIndexBuffer(2,histogramBuffer,INDICATOR_DATA);
   SetIndexBuffer(3,histogramColors,INDICATOR_COLOR_INDEX);

   SetIndexBuffer(4,histogram2Buffer1,INDICATOR_DATA);
   SetIndexBuffer(5,histogram2Buffer2,INDICATOR_DATA);
   SetIndexBuffer(6,histogram2Colors,INDICATOR_COLOR_INDEX);

   SetIndexBuffer(7,upArrowBuffer,INDICATOR_DATA);
   SetIndexBuffer(8,upArrowColors,INDICATOR_COLOR_INDEX);

   SetIndexBuffer(9,downArrowBuffer,INDICATOR_DATA);
   SetIndexBuffer(10,downArrowColors,INDICATOR_COLOR_INDEX);

   SetIndexBuffer(11,candleBuffer1,INDICATOR_DATA);
   SetIndexBuffer(12,candleBuffer2,INDICATOR_DATA);
   SetIndexBuffer(13,candleBuffer3,INDICATOR_DATA);
   SetIndexBuffer(14,candleBuffer4,INDICATOR_DATA);
   SetIndexBuffer(15,candleColors,INDICATOR_COLOR_INDEX);

   SetIndexBuffer(16,line2Buffer,INDICATOR_DATA);
   SetIndexBuffer(17,line2Colors,INDICATOR_COLOR_INDEX);
//--- setting a code from the Wingdings charset as the property of PLOT_ARROW
//1.3指标对应的是plot的个数(windings查看图标代码)
   PlotIndexSetInteger(3,PLOT_ARROW,225);
   PlotIndexSetInteger(4,PLOT_ARROW,226);

//2.2初始化句柄
   ma5_h=iMA(NULL,0,5,0,0,0);
   ma10_h=iMA(NULL,0,10,0,0,0);
   return(INIT_SUCCEEDED);
  }
//+------------------------------------------------------------------+
//| Custom indicator iteration function                              |
//+------------------------------------------------------------------+
int OnCalculate(const int rates_total,
                const int prev_calculated,
                const datetime &time[],
                const double &open[],
                const double &high[],
                const double &low[],
                const double &close[],
                const long &tick_volume[],
                const long &volume[],
                const int &spread[])
  {
//2.3创建赋值数组
   double ma5[];
   CopyBuffer(ma5_h,0,0,rates_total,ma5);
   double ma10[];
   CopyBuffer(ma10_h,0,0,rates_total,ma10);
//2.4
//多计算一根 【一般只会有新k线出来的时候,才会多计算一根】
   int start=(prev_calculated>0)?(prev_calculated-1):0;

//3.2数组越界保护(原因:line2Buffer[i-1])
   start=(start>0)?start:1;

   for(int i=start;ima5[i])
        {
         lineColors[i]=1;
        }
      else
        {
         lineColors[0]=0;
        }

      if(close[i]>ma10[i])
        {
         line2Colors[i]=0;
        }
      else
        {
         line2Colors[0]=1;
        }
      //3.金叉死叉画法
      //3.2金叉
      if(lineBuffer[i-1]=line2Buffer[i])
        {
         upArrowBuffer[i]=line2Buffer[i]-100*Point();
         if((lineBuffer[i]-line2Buffer[i])<50*Point())
           {
            upArrowColors[i]=0;
           }
         else
           {
            upArrowColors[i]=1;
           }
        }
      //3.3死叉
      if(lineBuffer[i-1]>line2Buffer[i-1] && lineBuffer[i]<=line2Buffer[i])
        {
         downArrowBuffer[i]=line2Buffer[i]+100*Point();
         if((line2Buffer[i]-lineBuffer[i])<50*Point())
           {
            downArrowColors[i]=0;
           }
         else
           {
            downArrowColors[i]=1;
           }
        }

      //4.柱状体
      //4.1 0-值
      //histogramBuffer[i]=ma5[i];
      //4.2 a-b
      histogram2Buffer1[i]=ma5[i];
      histogram2Buffer2[i]=ma10[i];

      if(lineBuffer[i]>=line2Buffer[i])
        {
         histogram2Colors[i]=0;
        }
      else
        {
         histogram2Colors[i]=1;
        }

      /*//5.蜡烛图
      candleBuffer1[i]=open[i]+100*Point();
      candleBuffer2[i]=high[i]+100*Point();
      candleBuffer3[i]=low[i]+100*Point();
      candleBuffer4[i]=close[i]+100*Point();

      if(candleBuffer1[i]>candleBuffer4[i])
       {
         candleColors[i]=0;
       }
      else
       {
         candleColors[i]=1;
       }*/
     }

   return(rates_total);
  }
//+------------------------------------------------------------------+
三自定义macd指标
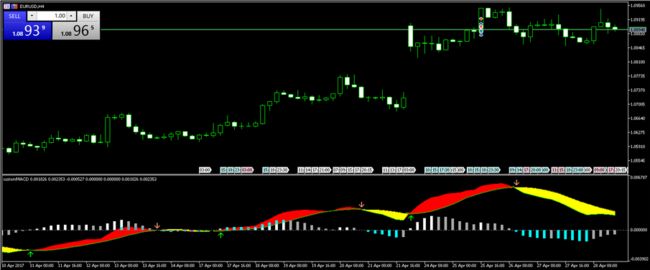
1、效果
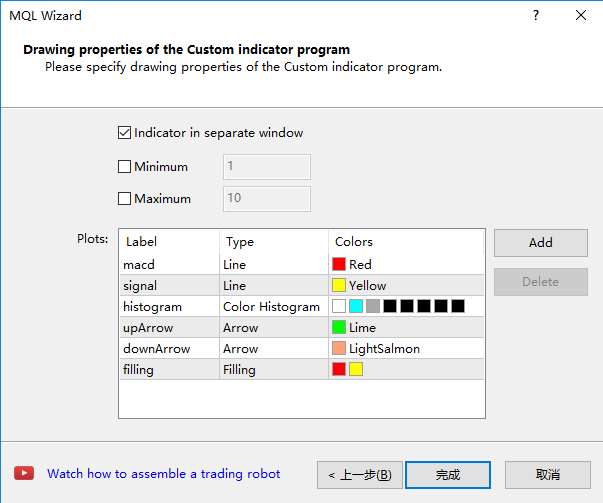
2.设置
3.实现
//+------------------------------------------------------------------+
//|                                                   customMACD.mq5 |
//|                        Copyright 2017, MetaQuotes Software Corp. |
//|                                             https://www.mql5.com |
//+------------------------------------------------------------------+
#property copyright "Copyright 2017, MetaQuotes Software Corp."
#property link      "https://www.mql5.com"
#property version   "1.00"
#property indicator_separate_window
#property indicator_buffers 8
#property indicator_plots   6
//--- plot macd
#property indicator_label1  "macd"
#property indicator_type1   DRAW_LINE
#property indicator_color1  clrRed
#property indicator_style1  STYLE_SOLID
#property indicator_width1  1
//--- plot signal
#property indicator_label2  "signal"
#property indicator_type2   DRAW_LINE
#property indicator_color2  clrYellow
#property indicator_style2  STYLE_SOLID
#property indicator_width2  1
//--- plot histogram
#property indicator_label3  "histogram"
#property indicator_type3   DRAW_COLOR_HISTOGRAM
#property indicator_color3  clrWhite,clrAqua,clrDarkGray,C'0,0,0',C'0,0,0',C'0,0,0',C'0,0,0',C'0,0,0'
#property indicator_style3  STYLE_SOLID
#property indicator_width3  3
//--- plot upArrow
#property indicator_label4  "upArrow"
#property indicator_type4   DRAW_ARROW
#property indicator_color4  clrLime
#property indicator_style4  STYLE_SOLID
#property indicator_width4  1
//--- plot downArrow
#property indicator_label5  "downArrow"
#property indicator_type5   DRAW_ARROW
#property indicator_color5  clrLightSalmon
#property indicator_style5  STYLE_SOLID
#property indicator_width5  1
//--- plot filling
#property indicator_label6  "filling"
#property indicator_type6   DRAW_FILLING
#property indicator_color6  clrRed,clrYellow
#property indicator_style6  STYLE_SOLID
#property indicator_width6  1

//--- input parameters
input int                InpFastEMA=12;               // Fast EMA period
input int                InpSlowEMA=26;               // Slow EMA period
input int                InpSignalSMA=9;              // Signal SMA period
input ENUM_APPLIED_PRICE InpAppliedPrice=PRICE_CLOSE; // Applied price

//--- indicator buffers
double         macdBuffer[];

double         signalBuffer[];

double         histogramBuffer[];
double         histogramColors[];

double         upArrowBuffer[];

double         downArrowBuffer[];

double         fillingBuffer1[];
double         fillingBuffer2[];
//2.句柄
int macd_h;
//+------------------------------------------------------------------+
//|                                                                  |
//+------------------------------------------------------------------+
int OnInit()
  {
//--- indicator buffers mapping
   SetIndexBuffer(0,macdBuffer,INDICATOR_DATA);
   SetIndexBuffer(1,signalBuffer,INDICATOR_DATA);
   SetIndexBuffer(2,histogramBuffer,INDICATOR_DATA);
   SetIndexBuffer(3,histogramColors,INDICATOR_COLOR_INDEX);
   SetIndexBuffer(4,upArrowBuffer,INDICATOR_DATA);
   SetIndexBuffer(5,downArrowBuffer,INDICATOR_DATA);
   SetIndexBuffer(6,fillingBuffer1,INDICATOR_DATA);
   SetIndexBuffer(7,fillingBuffer2,INDICATOR_DATA);
//--- setting a code from the Wingdings charset as the property of PLOT_ARROW
//3.设置箭头类型
   PlotIndexSetInteger(3,PLOT_ARROW,225);
   PlotIndexSetInteger(4,PLOT_ARROW,226);
//3.1 什么都不画
   PlotIndexSetDouble(3,PLOT_EMPTY_VALUE,0);
   PlotIndexSetDouble(4,PLOT_EMPTY_VALUE,0);

//2.3句柄初始化
   macd_h=iMACD(NULL,0,InpFastEMA,InpSlowEMA,InpSignalSMA,InpAppliedPrice);
   return(INIT_SUCCEEDED);
  }
//+------------------------------------------------------------------+
//| Custom indicator iteration function                              |
//+------------------------------------------------------------------+
int OnCalculate(const int rates_total,
                const int prev_calculated,
                const datetime &time[],
                const double &open[],
                const double &high[],
                const double &low[],
                const double &close[],
                const long &tick_volume[],
                const long &volume[],
                const int &spread[])
  {
//2.4创建赋值数组
   double macd[];
   double signal[];
   CopyBuffer(macd_h,0,0,rates_total,macd);
   CopyBuffer(macd_h,1,0,rates_total,signal);

   int start=(prev_calculated>0)?(prev_calculated-1):0;
//1.数组越界保护(原因:line2Buffer[i-1])
   start=(start>0)?start:1;
   for(int i=start;i0)
        {
         if(histogramBuffer[i]>histogramBuffer[i-1])
           {
            histogramColors[i]=0;
           }
         else
           {
            histogramColors[i]=2;
           }
        }
      else
        {
         if(histogramBuffer[i]signalBuffer[i] && macdBuffer[i-1]signalBuffer[i-1])
        {
         downArrowBuffer[i]=signalBuffer[i]+50*Point();
        }

      //4.填充值设好上边界和下边界即可
      fillingBuffer1[i]=macdBuffer[i];
      fillingBuffer2[i]=signalBuffer[i];
     }
   return(rates_total);
  }
//+------------------------------------------------------------------+
如果您发现本文对你有所帮助,如果您认为其他人也可能受益,请把它分享出去。


