泰坦尼克号各种因素对存活率的影响
泰坦尼克号背景介绍
泰坦尼克号是一艘奥林匹克级邮轮,于1912年4月首航时撞上冰山后沉没。泰坦尼克号由位于北爱尔兰贝尔法斯特的哈兰·沃尔夫船厂兴建,是当时最大的客运轮船,由于其规模相当一艘现代航空母舰,因而号称“上帝也沉没不了的巨型邮轮”。在泰坦尼克号的首航中,从英国南安普敦出发,途经法国瑟堡-奥克特维尔以及爱尔兰昆士敦,计划横渡大西洋前往美国纽约市。但因为人为错误,于1912年4月14日船上时间夜里11点40分撞上冰山;2小时40分钟后,即4月15日凌晨02点20分,船裂成两半后沉入大西洋,死亡人数超越1500人,堪称20世纪最大的海难事件,同时也是最广为人知的海难之一。
import pandas as pd
import numpy as np
import seaborn as sns
import matplotlib.pyplot as plt
import matplotlib as mpl

mpl.rcParams['font.sans-serif'] = ['SimHei']
mpl.rcParams['font.serif'] = ['SimHei']
#解决负号'-'显示为方块的问题
mpl.rcParams['axes.unicode_minus'] = False
%matplotlib inline
%config InlineBackend.figure_format = 'retina'

file = "titanic_train.csv"
df = pd.read_csv("F:/All_Py_Data/program02/%s" %file,encoding="gbk")
df.head()
数据字段说明
- PassengerId: 乘客的id
- Survival: 是否幸存 0 = No, 1 = Yes
- Pclass: 舱位 class 1 = 1st, 2 = 2nd, 3 = 3rd
- Name: 姓名
- Sex: 性别
- Age: 年龄
- SibSp: 船上兄弟姐妹以及配偶的个数
- Parch: 船上父母以及者子女的个数
- Ticket: 船票号码
- Fare: 票价
- Cabin: 船舱号码
- Embarked: 登船码头 C = Cherbourg, Q = Queenstown, S = Southampton
数据的统计描述
- 数值变量
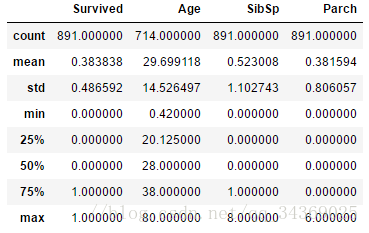
df[["Survived","Age", "SibSp", "Parch"]].describe()各仓位分布情况:
df.groupby('Pclass').agg('size')/(len(df))Pclass 1 0.242424 2 0.206510 3 0.551066 dtype: float64
各个变量的缺失值情况:
df.isnull().sum()PassengerId 0 Survived 0 Pclass 0 Name 0 Sex 0 Age 177 SibSp 0 Parch 0 Ticket 0 Fare 0 Cabin 687 Embarked 2 dtype: int64
df.info()RangeIndex: 891 entries, 0 to 890 Data columns (total 12 columns): PassengerId 891 non-null int64 Survived 891 non-null int64 Pclass 891 non-null int64 Name 891 non-null object Sex 891 non-null object Age 714 non-null float64 SibSp 891 non-null int64 Parch 891 non-null int64 Ticket 891 non-null object Fare 891 non-null float64 Cabin 204 non-null object Embarked 889 non-null object dtypes: float64(2), int64(5), object(5) memory usage: 83.6+ KB
以上可以看出 主要缺失值在age和cabin中,先通过男女乘客各自年龄中值填补age
df.Age.describe()count 714.000000 mean 29.699118 std 14.526497 min 0.420000 25% 20.125000 50% 28.000000 75% 38.000000 max 80.000000 Name: Age, dtype: float64
age_median = df.groupby("Sex").Age.median()
age_median
Sex female 27.0 male 29.0 Name: Age, dtype: float64
age_median2 = age_median.male
df.Age.fillna(age_median2,inplace=True)
df.isnull().sum()
PassengerId 0 Survived 0 Pclass 0 Name 0 Sex 0 Age 0 SibSp 0 Parch 0 Ticket 0 Fare 0 Cabin 687 Embarked 2 dtype: int64
因为Cabin确实数量已经接近70%,所以,可以考虑删除这变量
df.drop('Cabin',1, inplace=True)
df.head()
数据初步解析
fig = plt.figure(figsize=(15,12))
plt.subplot2grid((2,3),(0,0))
ax = df.Survived.value_counts().plot(kind="bar",rot=0,alpha=0.7,fontsize=17)
plt.title("获救情况 (1为获救)",fontsize=17)
plt.ylabel("人数",fontsize=17)

plt.subplot2grid((2,3),(0,1))
df.Pclass.value_counts().plot(kind="bar",rot=0,alpha=0.7,fontsize=17)
plt.ylabel("人数")
plt.title("乘客等级分布")

plt.subplot2grid((2,3),(0,2))
df.Sex.value_counts().plot(kind="bar",rot=0,alpha=0.7,fontsize=17)
plt.ylabel("人数",fontsize=17)
plt.title("乘客男女分布",fontsize=17)

plt.subplot2grid((2,3),(1,0),colspan=2)
ax1 = df.Age[df.Pclass == 1].plot(kind='kde',alpha=0.7,fontsize=17)
df.Age[df.Pclass == 2].plot(kind='kde',alpha=0.7)
df.Age[df.Pclass == 3].plot(kind='kde',alpha=0.7)
# plt.xlabel("年龄")
plt.ylabel("密度",fontsize=17)
plt.title("各等级的乘客年龄分布",fontsize=17)
plt.legend(('头等舱', '2等舱','3等舱'),loc='best',fontsize=17)

plt.subplot2grid((2,3),(1,2))
# df.Embarked.value_counts().plot(kind='bar',rot =0,alpha=0.7,fontsize=18)
df.Embarked.value_counts().plot.pie(fontsize=18)
plt.title("不同登船码头人数",fontsize=17)
plt.ylabel("") 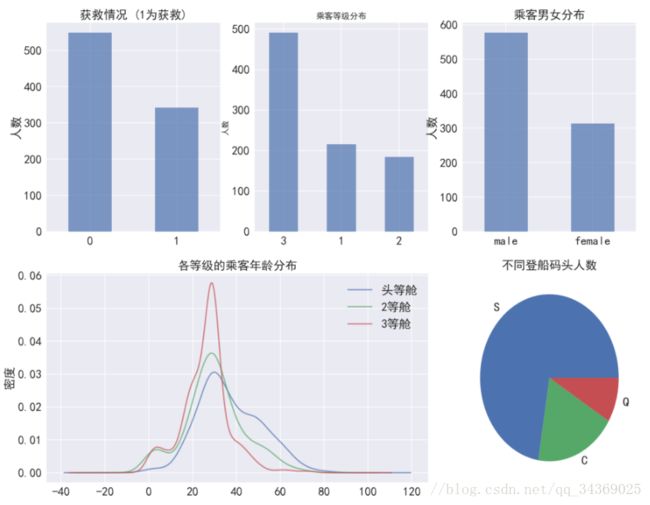
由上面这些图,我们可以看出:
- 遇难的人多于获救的人,获救的人300多
- 三等舱的人数最多,相当于1、2等舱总和
- 三个仓位的年龄趋势大概也一致,都集中在20-40岁之间。一个细微差别是,3等舱20岁左右的年轻人居多,头等舱30多岁的人居多,或许可以透露出地位和年龄的关系
- 登录码头S,远大于另外两个码头的登录人数
不同变量和幸存的关系
幸存和各个变量的相关性(初步)
df_corr = df.corr()
df_corr 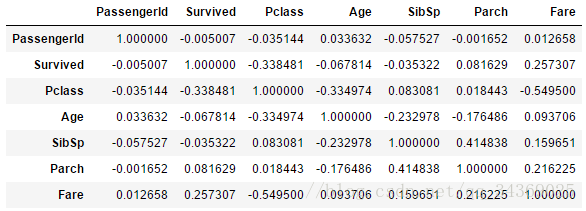
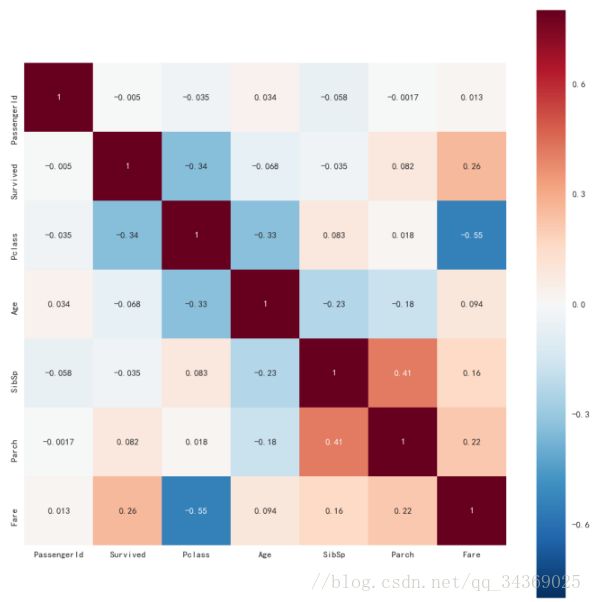
关系热力图会更加直观
fig = plt.figure(figsize = (12, 12))
sns.heatmap(df_corr, vmax=.8, square=True, annot=True)
一、仓位和幸存的关系
df[['Pclass','Survived']].groupby('Pclass').mean()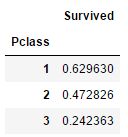
fig = plt.figure(figsize=(12,6))
ax1 = plt.subplot(121)
plt.title("舱位和幸存的关系",fontsize=17)
# ax1.set(ylabel='人数比',title="舱位和幸存的关系")
sns.barplot(data=df,x='Pclass',y='Survived',ci=None)
plt.xlabel("舱位等级",fontsize=17)
plt.ylabel("人数比",fontsize=17)

ax2 = plt.subplot(122)
Survived_0 = df.Pclass[df.Survived == 0].value_counts()
Survived_1 = df.Pclass[df.Survived == 1].value_counts()
df2=pd.DataFrame({u'获救':Survived_1, u'未获救':Survived_0})
df2.plot(kind='bar', stacked=True,ax=ax2,rot=0)
plt.title("各舱位等级的获救情况",fontsize=17)
plt.xlabel("舱位等级",fontsize=17)
plt.ylabel("人数",fontsize=17)
plt.legend(fontsize=17)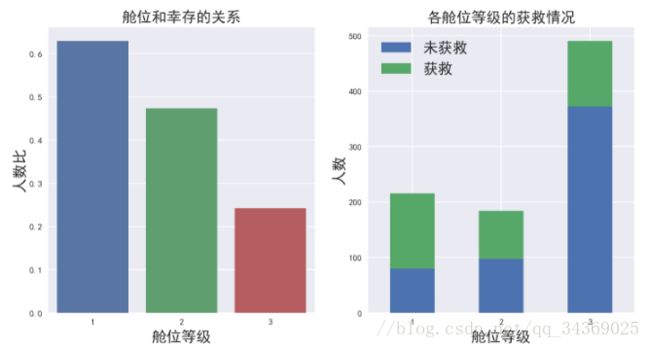
可以明显看出仓位(地位)等级的高低直接影响着幸存率,仓位等级越高,获救的可能性越大
二、性别和幸存的关系
df[['Sex','Survived']].groupby('Sex').mean()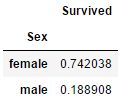
fig = plt.figure(figsize=(12,6))
ax1 = plt.subplot(121)
plt.title("性别和幸存的关系",fontsize=17)
sns.barplot(data=df,x='Sex',y='Survived',ci=None)
plt.ylabel("获救率",fontsize=17)
plt.xlabel("性别",fontsize=17)
plt.xticks([0,1],["女","男"],fontsize=17)

ax2 = plt.subplot(122)
Survived_0 = df.Sex[df.Survived == 0].value_counts()
Survived_1 = df.Sex[df.Survived == 1].value_counts()
df2=pd.DataFrame({u'未获救':Survived_0, u'获救':Survived_1})
df2.plot(kind='bar', stacked=True,ax=ax2,rot=0)
plt.title("性别和幸存的关系",fontsize=17)
plt.xlabel("性别",fontsize=17)
plt.ylabel("人数",fontsize=17)
plt.xticks([0,1],["女","男"],fontsize=17)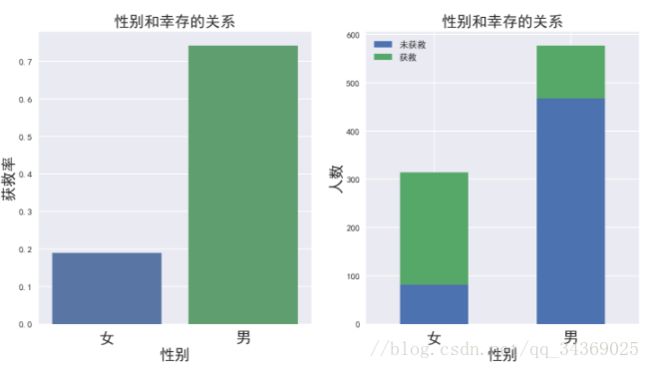
- 这充分说明了欧洲人践行的,女士优先理念,女性的获救率远高于男性
- 为了解性别在仓位不同情况下的幸存情况,我们进一步分析,如下:
fig=plt.figure(figsize=(16,10))
# fig.set(alpha=0.7)
plt.title(u"根据舱等级和性别的获救情况",fontsize=17)

ax1=fig.add_subplot(161)
df.Survived[df.Sex == 'female'][df.Pclass == 1].value_counts().plot(kind='bar', color='#FA2479',fontsize=17)
ax1.set_xticklabels([u"获救", u"未获救"], rotation=0)
ax1.legend([u"女性/1级舱"], fontsize=15)

ax2=fig.add_subplot(162, sharey=ax1)
df.Survived[df.Sex == 'female'][df.Pclass == 2].value_counts().plot(kind='bar', color='pink',fontsize=17)
ax2.set_xticklabels([u"未获救", u"获救"], rotation=0)
plt.legend([u"女性/2级舱"], fontsize=15)

ax3=fig.add_subplot(163, sharey=ax1)
df.Survived[df.Sex == 'female'][df.Pclass == 3].value_counts().plot(kind='bar',color='pink',fontsize=17)
ax3.set_xticklabels([u"未获救", u"获救"], rotation=0)
plt.legend([u"女性/3级舱"], fontsize=15)

ax4=fig.add_subplot(164, sharey=ax1)
df.Survived[df.Sex == 'male'][df.Pclass == 1].value_counts().plot(kind='bar', color='lightblue',fontsize=17)
ax4.set_xticklabels([u"未获救", u"获救"], rotation=0)
plt.legend([u"男性/1级舱"], fontsize=15)

ax5=fig.add_subplot(165, sharey=ax1)
df.Survived[df.Sex == 'male'][df.Pclass == 2].value_counts().plot(kind='bar',  color='steelblue',fontsize=17)
ax5.set_xticklabels([u"未获救", u"获救"], rotation=0)
plt.legend([u"男性/2级舱"], fontsize=15)

ax6=fig.add_subplot(166, sharey=ax1)
df.Survived[df.Sex == 'male'][df.Pclass == 3].value_counts().plot(kind='bar', color='steelblue',fontsize=17)
ax6.set_xticklabels([u"未获救", u"获救"], rotation=0)
plt.legend([u"男性/3级舱"],fontsize=15)

# plt.show()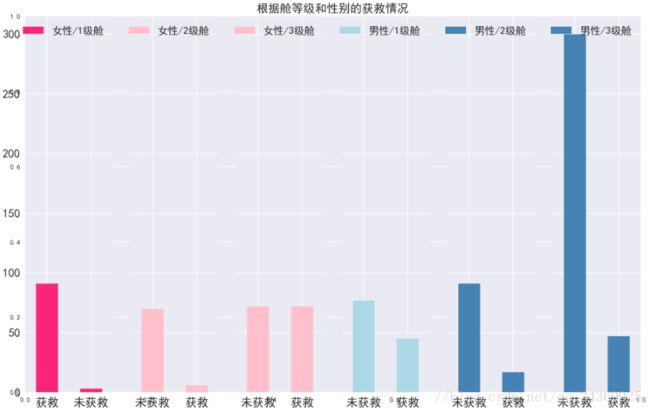
一等舱和二等舱的女性大部分获救,而三等舱女性遇难和获救人数持平。另一方面,男性不管是哪个仓位,获救的人都比女性少很多。并且与女性高级仓相反,身为最低级舱位的男性,大部分遇难
df_age = df[['Age','Survived']]
df_age['quartiles'] = pd.cut(df_age.Age,bins=[0,10,20,30,40,50,60,70,80])
# df_age.plot(kind="bar")
# df_age
df_age_count = df_age.groupby(['quartiles','Survived']).count()
# df_age_count = df_age_count.reset_index()
df_age_count.unstack()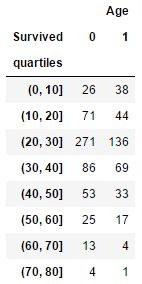
fig = plt.figure()
df_age_count = df_age_count.unstack().Age
df_age_count.columns = ["遇难","生存"]
ax = df_age_count.plot(kind='bar',label="aaa",title="不同年龄阶段的和幸存关系",rot=20,figsize=[10,10],fontsize=18)
ax.set_xlabel("年龄区间",fontsize=17)
ax.legend(fontsize=17)
ax.title(fontsize=17)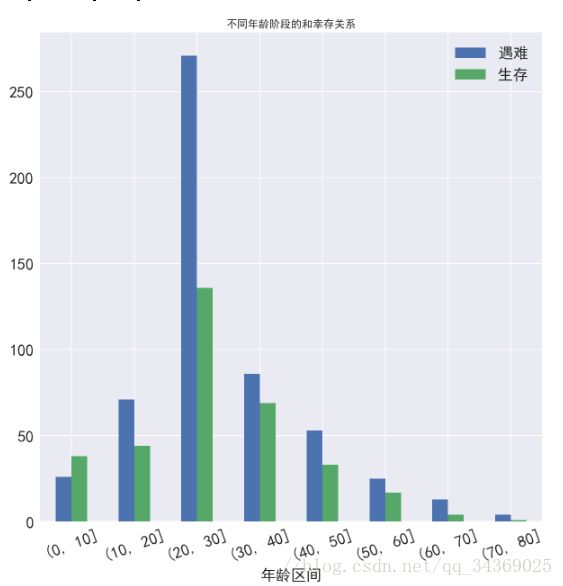
跟女士一样,婴幼儿儿童在施救过程中也有被比较好的照顾到,0-10岁区间内,是唯一获救人数大于遇难人数的区间
plt.figure(figsize=(12,6))
plt.subplot(121)
sns.barplot(data=df,x="Embarked",y="Survived",ci=None)
plt.xlabel("登船港口")
plt.ylabel("存活率")
plt.subplot(122)
sns.pointplot(data=df, x='Embarked', y='Survived', hue='Sex', ci=None)
plt.legend(["男","女"])
plt.xlabel("登船港口")
plt.ylabel("存活率")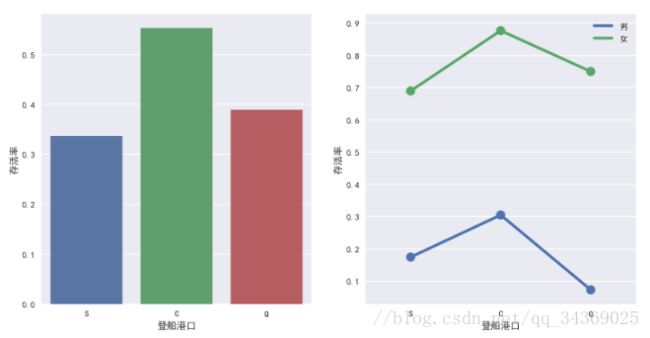
不同登船的港口也影响到幸存率,虽然S的登录人数最高,但是幸存率是最低的。与此同时,性别和登船港口没有直接的联系。
那么不同登船港口幸存率不同,是否和登船人的身份地位有关呢?那么,进一步解析:
ser_Embarked01 = df.Pclass[df.Embarked == "S"].value_counts()
ser_Embarked02 = df.Pclass[df.Embarked == "C"].value_counts()
ser_Embarked03 = df.Pclass[df.Embarked == "Q"].value_counts()
df_Embarked = pd.DataFrame({"Q":ser_Embarked03,"C":ser_Embarked02,"S":ser_Embarked01}).T
ax = df_Embarked.plot(kind="bar",rot=0,figsize=(8,8),colormap="Reds",fontsize=17)
ax.legend(fontsize = 17)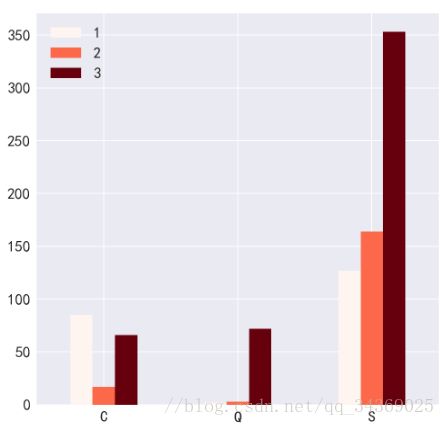
Q登船港口虽然几乎都是3等舱的人,但是幸存率并不是最低的,所以登船港口和船舱等级没有直接联系
五、有无家人(兄弟姐妹配偶、父母和子女)和幸存的关系
def getCount(x):
    if x > 0:
        x = "有"
    else:
        x = "无"
    return x
# fig = plt.figure(figsize=(15,10))
#有无配偶或兄弟姐妹
# plt.subplot2grid((2,3),(0,0))
df_SibSp2_Survived = df[["Survived","SibSp"]]
df_SibSp2_Survived['SibSp2'] = df_SibSp2_Survived.SibSp.apply(getCount)
df_SibSp2_Survived2 = df_SibSp2_Survived.groupby(["SibSp2","Survived"]).count()
df_SibSp2_Survived2 = df_SibSp2_Survived2.SibSp.reset_index()
df_SibSp2_Survived2.groupby("")

fig = plt.figure(figsize=(12,6))
ax1 = plt.subplot(121)
#有无配偶或兄弟姐妹
se1 = df.Survived[df.SibSp>0].value_counts()
se2 = df.Survived[df.SibSp==0].value_counts()
df_SibSp =  pd.DataFrame({"有兄弟姐妹或配偶":se1,"无兄弟姐妹或配偶":se2}).T
df_SibSp.plot(kind="bar",rot=0,ax=ax1,fontsize=17)
plt.legend(["遇难","获救"],fontsize=17)
plt.title("有无兄弟姐妹或配偶",fontsize=17)
plt.ylabel("人数",fontsize=17)

ax2 = plt.subplot(122)
se1 = df.Survived[df.Parch>0].value_counts()
se2 = df.Survived[df.Parch==0].value_counts()
pd.DataFrame({"有父母子女":se1,"无父母子女":se2}).T.plot(kind="bar",rot=0,ax=ax2,fontsize=17)
plt.title(u"有无父母子女",fontsize=17)
plt.ylabel(u"人数",fontsize=17)
plt.legend(["遇难","获救"],fontsize=17)
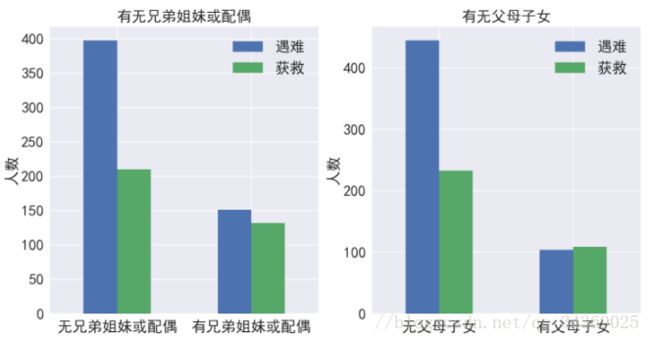
* 由上图可见,不管是船上有兄弟姐妹或者其他家庭成员,比孤身一人求生的存活率提高了不少。
* 进一步进行预测,当一家中的主要男性存活下来时,其妻子或者孩子存活率是否会更大。
def getName(name):
    name2 = name.split(" ")[2].strip()
    return name2
df["Name2"] = df.Name.apply(getName)
df.head()
died = 0
survived = 0
numb= 0
def getSurvivedNumb():
global survived,died,numb
for oneName in df["Name"]:
postion = df.Name.tolist().index(oneName)
one_SibSp = df.SibSp[postion]
one_Parch = df.Parch[postion]
one_Sex = df.Sex[postion]
one_Survived = df.Survived[postion]
one_Age = df.Age[postion]
one_Pclass = df.Pclass[postion]
if (one_SibSp > 0 or one_Parch > 0) and one_Survived == 1 and one_Age>=18 and one_Sex == "male":
numb+=1
for oneName2 in df["Name"]:
postion2 = df.Name.tolist().index(oneName2)
one_Pclass2 = df.Pclass[postion2]
if postion2 == postion or one_Pclass != one_Pclass2:
continue
name = oneName.split(" ")[2].strip()
name2 = oneName2.split(" ")[2].strip()
if name != name2:
continue
if (one_SibSp == df.SibSp[postion2] or one_Parch == df.Parch[postion2]) and (df.Sex[postion2] == "femal" or df.Age[postion2]