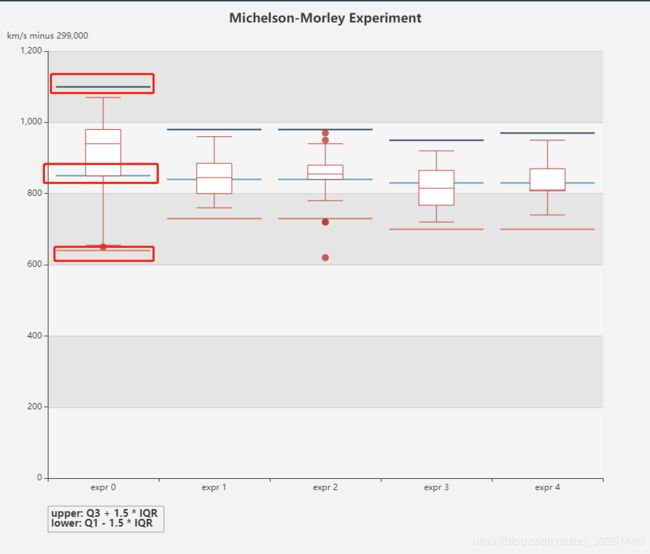
Echarts盒须图另外添加上公差(上限),下公差(下限),中间线
简单在网页上实践:
此案例根据echar(https://echarts.apache.org/examples/zh/editor.html?c=cycle-plot)案例修改而来,如有错误还请多多指教!
第一步: 首先咱们进入echars盒须图案例
https://echarts.apache.org/examples/zh/editor.html?c=boxplot-light-velocity
第二部: 赋值我修改的代码,替换他的
var data = echarts.dataTool.prepareBoxplotData(
[
    [850, 740, 900, 1070, 930, 850, 950, 980, 980, 880, 1000, 980, 930, 650, 760, 810, 1000, 1000, 960, 960],
    [960, 940, 960, 940, 880, 800, 850, 880, 900, 840, 830, 790, 810, 880, 880, 830, 800, 790, 760, 800],
    [880, 880, 880, 860, 720, 720, 620, 860, 970, 950, 880, 910, 850, 870, 840, 840, 850, 840, 840, 840],
    [890, 810, 810, 820, 800, 770, 760, 740, 750, 760, 910, 920, 890, 860, 880, 720, 840, 850, 850, 780],
    [890, 840, 780, 810, 760, 810, 790, 810, 820, 850, 870, 870, 810, 740, 810, 940, 950, 800, 810, 870]
]);
var dataByMonth = data.boxData;
/*数值请自行修改*/
var averageByMonth = [1100, 980, 980, 950, 970];//上
var averageByMonth1 = [850, 840, 840, 830, 830];//中
var averageByMonth2 = [640, 730, 730,700, 700];//下

function renderAverageItem(param, api) {
    var bandWidth = api.size([0, 0])[0] * 0.85;
    var point = api.coord([api.value(0), api.value(1)]);

    return {
        type: 'line',
        shape: {
            x1: point[0] - bandWidth / 2,
            x2: point[0] + bandWidth / 2,
            y1: point[1],
            y2: point[1]
        },
        style: api.style({
            fill: null,
            stroke: api.visual('color'),
            lineWidth: 2
        })
    };
}

option = {
    title: [
        {
            text: 'Michelson-Morley Experiment',
            left: 'center',
        },
        {
            text: 'upper: Q3 + 1.5 * IQR \nlower: Q1 - 1.5 * IQR',
            borderColor: '#999',
            borderWidth: 1,
            textStyle: {
                fontSize: 14
            },
            left: '10%',
            top: '90%'
        }
    ],
    tooltip: {
        trigger: 'item',
        axisPointer: {
            type: 'shadow'
        }
    },
    grid: {
        left: '10%',
        right: '10%',
        bottom: '15%'
    },
    xAxis: {
        type: 'category',
        data: data.axisData,
        boundaryGap: true,
        nameGap: 30,
        splitArea: {
            show: false
        },
        axisLabel: {
            formatter: 'expr {value}'
        },
        splitLine: {
            show: false
        }
    },
    yAxis: {
        type: 'value',
        name: 'km/s minus 299,000',
        splitArea: {
            show: true
        }
    },
    series: [
        {
            name: 'boxplot',
            type: 'boxplot',
            data: data.boxData,
            tooltip: {
                formatter: function (param) {
                    return [
                        'Experiment ' + param.name + ': ',
                        'upper: ' + param.data[5],
                        'Q3: ' + param.data[4],
                        'median: ' + param.data[3],
                        'Q1: ' + param.data[2],
                        'lower: ' + param.data[1]
                    ].join('
');
                }
            }
        },
        {
            name: 'outlier',
            type: 'scatter',
            step: 'start',
            data: data.outliers
        },
        {
            type: 'custom',
            name: '上限',
            renderItem: renderAverageItem,
            encode: {
                x: 0,
                y: 1
            },
            data: averageByMonth
        },
        {
            type: 'custom',
            name: '中间线',
            renderItem: renderAverageItem,
            encode: {
                x: 0,
                y: 1
            },
            data: averageByMonth1
        },
        {
            type: 'custom',
            name: '下限',
            renderItem: renderAverageItem,
            encode: {
                x: 0,
                y: 1
            },
            data: averageByMonth2
        }
    ]
};