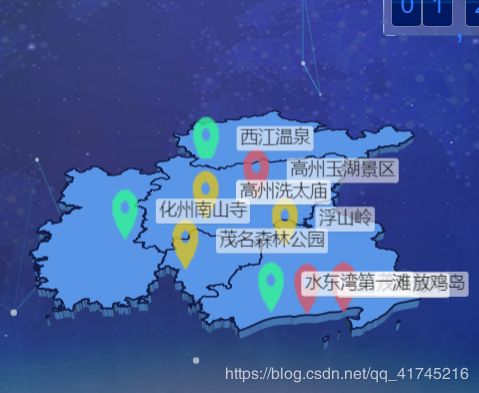
echarts使用3d地图,解决塌陷
echarts使用3d地图打点
先上图

1、要提前准备好 茂名市.json文件,在使用的时候使用axios异步加载,如果是加载3d省级或者省以上可以参考这篇的引入方式
2、还要安装一些依赖包
1.依赖包:
npm install echarts -S
npm install echarts-gl -S
2、main.js:
import echarts from 'echarts'
import 'echarts-gl'
Vue.prototype.$echarts = echarts
下面直接粘代码吧,跟平常使用echarts 差不多
<template>
    <div id="mapinfo" ref="map" :style="{width: '100%', height: `${info_canvas}`}" />
</template>
<script>
export default {
	data(){
	   return{
      	 info_canvas: '56vh',
      }
	},
    mounted () {
      this.mapInit()
    },
	methods:{
	  mapInit () {
      const self = this
      this.$axios.$get('./json/maoming.json').then((data) => {
      //文件路径要写对我是放到static的文件夹中,看个人需求
        const d = []
        for (let i = 0; i < data.features.length; i++) {
          d.push({
            name: data.features[i].properties.name,
            value: Math.ceil(Math.random() * 10)
          })
        }
        self.$echarts.registerMap('maoming', data)
        this.glInit('maoming', d)
      })
    },
    glInit (map, d) {
      // const self = this
      const geoCoordMap = {
        '电白浪漫海岸': [111.142701, 21.463603],
        '茂名放鸡岛': [111.237028, 21.480818],
        '高州玉湖景区': [111.0208, 22.044275],
        '高州洗太庙': [110.857382, 21.916856],
        '茂名森林公园': [110.824607, 21.62663],
        '浮山岭': [111.105659, 21.78524],
        '水东湾第一滩': [111.052591, 21.455947],
        '西江温泉': [110.830265, 22.307987],
        '化州南山寺': [110.635421, 21.75426],
        '': [110.635421, 21.75426]
      }
      //最后的空的是给一个最小值这样打的点不会塌陷到地图里面。
      // eslint-disable-next-line no-unused-vars
      const convertData = function (data) {
        const res = []
        for (let i = 0; i < data.length; i++) {
          const geoCoord = geoCoordMap[data[i].name]
          if (geoCoord) {
            res.push({
              name: data[i].name,
              value: geoCoord.concat(data[i].value)
            })
          }
        }
        return res
      }
      const iconLD = 'path://M512 144.896c-141.312 0-256.512 115.2-256.512 256.512 0 178.688 164.864 372.224 227.328 445.44 9.728 11.776 15.872 18.944 18.432 22.528 2.56 3.584 6.656 5.632 10.752 5.632 3.584 0 7.168-1.536 9.728-4.096l1.024-1.024 0.512-1.024c2.048-3.072 7.68-9.728 18.944-23.04 61.952-73.728 226.816-268.8 226.816-444.416C768.512 260.096 653.312 144.896 512 144.896z m0 352.256c-52.736 0-95.744-43.008-95.744-95.744s43.008-95.744 95.744-95.744 95.744 43.008 95.744 95.744-43.008 95.744-95.744 95.744z'
      const mapOption = {
        title: {
          text: '',
          x: 'left',
          top: '10',
          textStyle: {
            color: '#000',
            fontSize: 14
          }
        },
        tooltip: {
          show: true
          // formatter:(params)=>{
          //   let data = "测试1:"+params.name + "
"+"值:"+ params.value[2]+"
"+"地理坐标:[" + params.value[0]+","+params.value[1] +"]";
          //   return data;
          // },
        },
        // 数据映射
        visualMap: [{
          show: true,
          type: 'piecewise',

          itemWidth: 20, // 图形的宽度,即长条的宽度。
          itemHeight: 40,
          // text: ['bar3D'],
          calculable: true,
          categories: ['4A', '3A', '其他'],
          textStyle: {
            color: '#fff'
          },
          inRange: {
            symbol: iconLD,
            color: ['#D65769', '#D9C124', '#32F597']
          },
          dimension: [
            [{ name: '4A' }],
            [{ name: '3A' }],
            [{ name: '其他' }]
          ], // 指定用数据的『哪个维度』,映射到视觉元素上。『数据』即 series.data。 可以把 series.data 理解成一个二维数组,其中每个列是一个维度,默认取 data 中最后一个维度
          seriesIndex: 3
        }],
        geo3D: {
          map,
          roam: true,
          boxDepth: 100, // 地图倾斜度
          regionHeight: 2, // 地图厚度
          label: {
            // show: true,
            textStyle: {
              color: '#fff', // 地图初始化区域字体颜色
              fontSize: 15,
              opacity: 1,
              backgroundColor: 'rgba(0,23,11,0)'
            }
          },
          itemStyle: {
            opacity: 1, // 透明度
            color: '#4575b4', // 地图颜色
            borderWidth: 1.5, // 分界线宽度
            borderColor: '#111C49' // 分界线颜色
          },
          emphasis: {
            label: {
              show: false, // 是否显示标签
              textStyle: {
                color: 'yellow', // 高亮文字颜色
                fontSize: 32,
                fontFamily: '微软雅黑'
              }
            }
          },
          viewControl: {
            distance: 140, // 地图视角 控制初始大小
            rotateSensitivity: 1, // 旋转
            zoomSensitivity: 1, // 缩放
            autoRotate: true,
            minBeta: -360,
            maxBeta: 360
          },
          light: { // 光照阴影
            main: {
              color: '#fff', // 光照颜色
              intensity: 1.2, // 光照强度
              shadowQuality: 'high', // 阴影亮度
              shadow: false, // 是否显示阴影
              alpha: 55,
              beta: 10
            },
            ambient: {
              intensity: 0.3
            }
          },
          shading: 'realistic',
          realisticMaterial: {
            detailTexture: '#fff', // 纹理贴图
            textureTiling: 1, // 纹理平铺,1是拉伸,数字表示纹理平铺次数
            roughness: 0, // 材质粗糙度,0完全光滑,1完全粗糙
            metalness: 0, // 0材质是非金属 ,1金属
            roughnessAdjust: 0
          },
          groundPlane: {
            show: false
          }
        },
        series: [
          {
            name: '4A',
            type: 'scatter3D',
            coordinateSystem: 'geo3D',
            minHeight: 3,
            symbol: `${iconLD}`,
            symbolSize: [20, 40],
            opacity: 1,
            label: {
              show: true,
              formatter: '{b}'
            },
            itemStyle: {
              color: '#D65769'
            },
            data: convertData([{
              name: '电白浪漫海岸',
              value: ((Math.random() * 100) + 100).toFixed(2)
            }, {
              name: '茂名放鸡岛',
              value: ((Math.random() * 100) + 100).toFixed(2)
            }, {
              name: '高州玉湖景区',
              value: ((Math.random() * 100) + 100).toFixed(2)
            }])
          }, {
            name: '3A',
            type: 'scatter3D',
            coordinateSystem: 'geo3D',
            // symbol: 'pin',
            minHeight: 3,
            symbol: `${iconLD}`,
            symbolSize: [20, 40],
            opacity: 1,
            label: {
              show: true,
              formatter: '{b}'
            },
            itemStyle: {
              color: '#D9C124'
              // borderWidth: 0.5,
              // borderColor: '#fff'
            },
            data: convertData([{
              name: '高州洗太庙',
              value: ((Math.random() * 100) + 100).toFixed(2)
            }, {
              name: '茂名森林公园',
              value: ((Math.random() * 100) + 100).toFixed(2)
            }, {
              name: '浮山岭',
              value: ((Math.random() * 100) + 100).toFixed(2)
            }])
          }, {
            name: '其他',
            type: 'scatter3D',
            coordinateSystem: 'geo3D',
            // symbol: 'pin',
            symbolSize: [20, 40],
            opacity: 1,
            minHeight: 3,
            symbol: `${iconLD}`,
            // symbol: 'pin',
            label: {
              show: true,
              formatter: '{b}'
            },
            itemStyle: {
              color: '#32F597'
            },
            data: convertData([{
              name: '水东湾第一滩',
              value: ((Math.random() * 100) + 100).toFixed(2)
            }, {
              name: '西江温泉',
              value: ((Math.random() * 100) + 100).toFixed(2)
            }, {
              name: '化州南山寺',
              value: ((Math.random() * 100) + 100).toFixed(2)
            }])
          }, {

            type: 'scatter3D',
            coordinateSystem: 'geo3D',
            // symbol: 'pin',
            symbolSize: [0, 0],
            opacity: 0,
            minHeight: 0,
            symbol: `${iconLD}`,
            // symbol: 'pin',
            label: {
              show: true,
              formatter: '{b}'
            },
            itemStyle: {
              color: '#32F597'
            },
            data: convertData([{
              name: '',
              value: 0
            }])
          }
        ]
      }
      console.log(mapOption)
      const myChart = this.$echarts.init(this.$refs.map)
      myChart.setOption(mapOption)
    },
	}
}
</script>
参考链接中国地图的3d渲染