L:python的Pandas模块:实例练习(泰坦尼克号数据集分析,电影票房统计,股票基本面统计)
实例练习
泰坦尼克号数据集分析
使用Seaborn库中包含的titanic数据集进行一些数据统计。
Seaborn是一个图形库,Anaconda已包含此库。数据集参见:
https://github.com/mwaskom/seaborn-data
import  seaborn  as  sns
tit = sns.load_dataset('titanic') # 读取数据集, 返回 DataFrame
tit.shape
Out: (891, 15)   		# 891行x15列
tit.head(3)

tit.columns
tit.to_excel('titanic.xlsx', index=False)  # 存为电子表格,便于观察
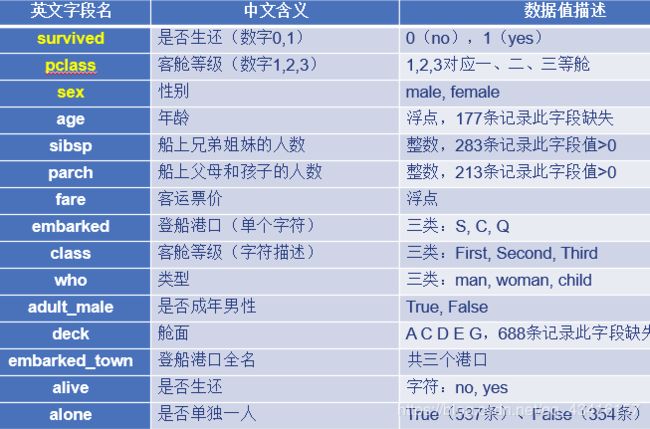
survived字段只有0和1两种取值,1代表生还。
tit.survived.unique()		# 取唯一值
Out: array([0, 1], dtype=int64)
tit['survived'].mean() 		# 总体的平均生还率
Out: 0.3838
tit.isnull().sum()         		# 查看各列数据的缺失情况
Out:
survived       0
pclass           0
sex                0
age            177

tit.pclass.value_counts()	# 统计每类客舱记录数
Out:
3    491
1    216
2    184

tit.groupby('pclass')['survived'].mean()  # 按客舱等级统计生还率
# 统计每个等级的平均票价、最高价、最低价
tit.groupby('pclass').fare.agg(['mean', 'max', 'min'])
从统计数据可以看出,一等客舱生还率最高,三等客舱生还率最低,
与之对应的是各等级客舱的票价也有很大差异。
tit = pd.read_excel('titanic.xlsx')           		# 读取Excel数据
fields = ['pclass', 'sex', 'who', 'embarked']		# 需做分类统计的字段
for  field  in  fields:				# 按不同字段统计生还率
    print(tit.groupby(field)['survived'].agg(['sum', 'count', 'mean']))
tit.groupby(['pclass','sex']).survived.mean()	# 按仓位等级/性别
for  field  in  ['sex', 'who', 'pclass', 'alone']:  	# 按不同字段计数
    print('\n', field)
    print(tit.transform(field).value_counts())

tit[(tit.age < 16)].groupby(['pclass'])['survived'].agg('mean')  # 16岁以下儿童
发现孩子的生还率很高,尤其是二等舱中生还率达到了惊人的100%。
电影票房统计
tushare是一个中文财经数据接口。利用该接口下载国内电影月票房榜数据,
然后做统计分析。
安装  pip   install   tushare
国内站点 pip  install  tushare  -i  https://pypi.tuna.tsinghua.edu.cn/simple
import  tushare  as  ts		# https://tushare.pro
# ts.set_token('你的token')  	# 执行一次在本机保存token,以后无需执行
pro = ts.pro_api()  		# 初始化 pro 接口
df = pro.bo_monthly(date='20190701')
df.columns  	# 字段含义见 https://tushare.pro/document/2?doc_id=113

新pro接口返回数据共11行,第0行是其他所有电影的合计票房,
1-10行是当月排名前十的电影。下面的代码按月下载2008—2019年月票房数据,保存为 promovie.xlsx
import  tushare  as  ts
import time
from pandas import DataFrame, Series
pro = ts.pro_api()  			# 初始化 pro 接口
movie = DataFrame()                         	# 生成一个DataFrame对象
for  year  in  range(2008, 2020):		# 2008—2019年
    for  mon  in  range(1,13):		# 1~12月
        date = '{:4d}{:02d}{:02d}'.format(year, mon,1)	# '20080101'格式
        df = pro.bo_monthly(date=date)	# 下载指定月票房
        movie = movie.append(df, ignore_index=True)  # 将df追加到movie中
        time.sleep(2)			# 休眠2s, 每分钟访问次数有限制
movie.to_excel('promovie.xlsx', index=False)
boxmonth.xlsx(2008.1-2019.8)数据含义
Irank:排名
MovieName:电影名称
WomIndex:口碑指数(很多缺失)
avgboxoffice:平均票价
avgshowcount:场均人次
box_pro:月度占比
boxoffice:单月票房(万元人民币)
days:月内上映天数
releaseTime:首映日期
month:月份
people:月观影人数
movie = pd.read_excel('boxmonth.xlsx')
movie.shape   # pd.set_option('display.max_column',11)
movie.loc[:, ['boxoffice', 'people']].sum()  # 总票房(万元),总观影人数
# 查看2008—2019年电影十大票房排行榜
m = movie[movie.MovieName!='其他']       		# 先排除“其他”行
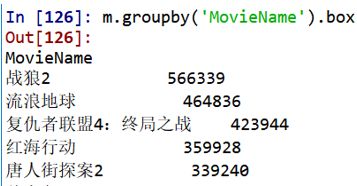
m.groupby('MovieName').boxoffice.sum().sort_values(ascending=False)[:10]

#统计年度票房和月度票房,然后绘制对比图形。
# 由于2019年月份数据不全,排除2019年数据, 只统计2008—2018年的数据
m = movie[movie.month.str[:4] != '2019']
# 按年度,str[:4]取出年份,以此分类统计,sort_index按索引年度顺序排列
ybox = m.groupby(m.month.str[:4]).boxoffice.sum().sort_index()
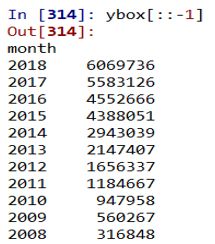
ybox[::-1]			# 票房年度额
import  matplotlib.pyplot  as  plt
plt.rcParams['font.sans-serif'] = ['SimHei']		# 指定中文黑体字体
ybox.plot(title='年票房', marker='o', fontsize=14)
mbox = m.groupby(m.month.str[5:7]).boxoffice.sum().sort_index()
mbox.plot(title='月票房', marker='o', fontsize=14)

近十年年度票房增长很快,从2008年的31亿元增加到了2018年的600亿元。电影月度消费差异很大,春节和暑假消费爆棚,所以这两个档期也是电影公司必争的黄金档期。
# 按年度统计观影人数,ascending=False降序
p=m.groupby(m.month.str[:4]).people.sum().sort_values(ascending=False)
Out:
2018    1718045678
2017    1622494840
# ... ...

# 计算年度人均票价“年度总票房(万元人民币)/观影人数”,保留1位小数
np.round(ybox*10000/p, 1)
Out:
2008    28.8
2009    30.8
2010    35.3

运算ybox*10000/p体现了Pandas索引运算的优势,两列统计数据都以年份为索引,
在运算时自动按年份匹配。
股票基本面统计
import  tushare  as  ts
stock = ts.get_stock_basics()    	# 股票基本面数据,公众接口可用
stock.to_excel('stock.xlsx')		# 保存为电子表格
stock.shape				# Out: (3678, 22)
stock.columns				# 字段集
数据字段详情查看 http://tushare.org/fundamental.html 。
这里用到的数据列有:code,股票代码;name,名称;industry,
所属行业;area,地区;pe,市盈率;totals,总股本(亿元人民币);
esp,每股收益;timeToMarket,上市日期。
df = pd.read_excel('stock.xlsx', dtype={'code': 'str'}) # code字符串类型
df.set_index('code', inplace=True)	# 将code设为索引列
df.loc['002522']            			# 显示某支股票基本面
len(df.industry.unique())   		# 显示行业数
df.area.unique().size    			# 显示地区数(即股票的归属省份)
# 按地区统计上市公司数量,体现地区经济实力
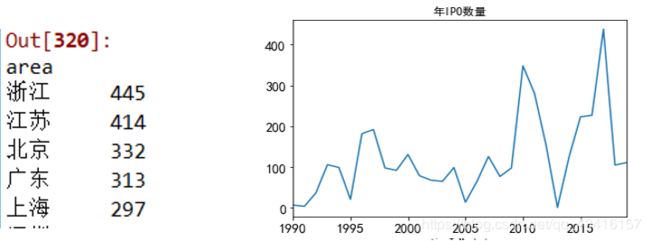
df.groupby('area').area.count().sort_values(ascending=False)
year = df.timeToMarket.astype('str').str[:4]  # 转为字符串,提取前4位的年份
yearnum = df.groupby(year).name.count()	 # 按年份统计,得到每年股票发行量
# 数据集中有几支股票没有发行年份(年份为0), 作图时排除0年份
import  matplotlib.pyplot  as  plt
plt.rcParams['font.sans-serif'] = ['SimHei']		# 中文字体
yearnum[yearnum.index!='0'].plot(fontsize=14, title='年IPO数量')
df.pe.mean()       		# 简单的算术平均pe
df[df.pe > 0].pe.mean() 	# 剔除亏损股票后计算pe均值

按总市值为权重计算加权pe。这里推算总市值的依据如下:
	股票单价 = 4*esp(每股收益)*pe(市盈率)
	总市值 = 股票单价*totals总股本(亿元人民币)
df['tvalue'] = 4 * df.esp * df.pe * df.totals  	# 计算总市值,增加新列tvalue
np.sum(df.pe * df.tvalue) / df.tvalue.sum()   # 计算以市值为权重的加权pe
Out: 48.87        # 等同于 np.average(df.pe, weights=df.tvalue)

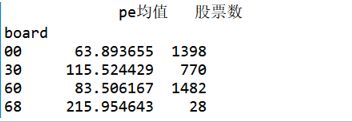
计算沪市(60开头)、深圳主板(00开头)、创业板(30开头)
及科创板(68开头)各板块的pe值和股票数。
df['board'] = df.index.str[:2]     # 取code的前2个字符,新增board列
# 按板块类型统计pe均值,计数
df.groupby('board').pe.agg([('pe均值', 'mean'), ('股票数', 'count')])
pandas其他练习题
1. https://blog.csdn.net/qq_41996090/article/details/88558868   十套练习
 上面练习的数据集地址 https://github.com/Rango-2017/Pandas_exercises
	https://www.kesci.com/
2.  https://blog.csdn.net/AvalancheM/article/details/81293149?depth_1-utm_source=distribute.pc_relevant.none-task-blog-BlogCommendFromBaidu-3&utm_source=distribute.pc_relevant.none-task-blog-BlogCommendFromBaidu-3
3.  https://zhuanlan.zhihu.com/p/94096219?utm_source=qq

4.  jupyter notebook  : 基于浏览器的IPython编程环境
 简介  https://www.jianshu.com/p/061c6e5c4b0d
(1).ipynb 练习文件下载,例如存在 D:\ ;
(2)进入命令行, 切换到 .ipynb文件所在目录, 执行 jupyter notebook


