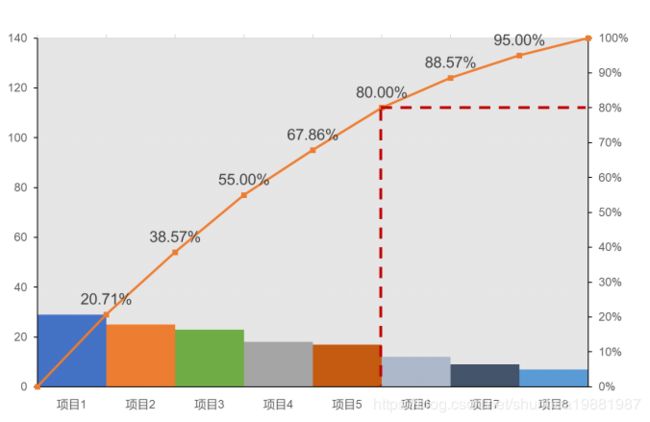
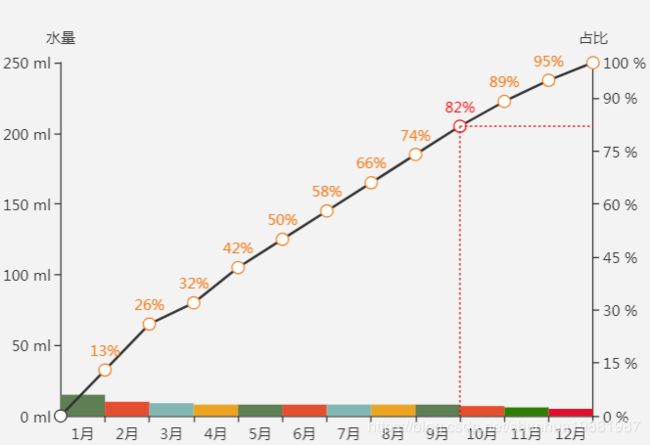
Echart 制作柏拉图——带二八法则线
一、使用场景
制作柏拉图,带二八法则线,柱状图显示不同的颜色,折点显示占比,在接近80%的折点的右方显示虚线到坐标轴位置,
要求图片
二、使用echarts制图,脚本如下:
app.title = '柏拉图';
option = {
//添加横线滚动条(解决数据太多时显示重叠问题):根据实际是否需要显示,不显示注释
dataZoom: {
start: 0, //默认为0
end: 90 - 1500 / 31, //默认为100
type: 'slider',
show: true,
xAxisIndex: [0,1],//需要缩放显示的横坐标的序号,多个用逗号分隔;[0,1]指分别缩放显示柱状图和折线图
handleSize: 1, //滑动条的 左右2个滑动条的大小
height: 15, //组件高度
left: 20, //左边的距离
right: 20, //右边的距离
bottom: 20, //右边的距离
fillerColor: new echarts.graphic.LinearGradient(1, 0, 0, 0, [{
//给颜色设置渐变色 前面4个参数,给第一个设置1,第四个设置0 ,就是水平渐变
//给第一个设置0,第四个设置1,就是垂直渐变
offset: 0,
color: '#3FA7DC'//横向滚动条的颜色
}, {
offset: 1,
color: '#eeeeee'//横向滚动条的颜色
}]),
//backgroundColor: 'rgba(0, 0, 0, 0)', //两边未选中的滑动条区域的颜色
showDataShadow: false, //是否显示数据阴影 默认auto
showDetail: false, //即拖拽时候是否显示详细数值信息 默认true
handleIcon: 'M-292,322.2c-3.2,0-6.4-0.6-9.3-1.9c-2.9-1.2-5.4-2.9-7.6-5.1s-3.9-4.8-5.1-7.6c-1.3-3-1.9-6.1-1.9-9.3c0-3.2,0.6-6.4,1.9-9.3c1.2-2.9,2.9-5.4,5.1-7.6s4.8-3.9,7.6-5.1c3-1.3,6.1-1.9,9.3-1.9c3.2,0,6.4,0.6,9.3,1.9c2.9,1.2,5.4,2.9,7.6,5.1s3.9,4.8,5.1,7.6c1.3,3,1.9,6.1,1.9,9.3c0,3.2-0.6,6.4-1.9,9.3c-1.2,2.9-2.9,5.4-5.1,7.6s-4.8,3.9-7.6,5.1C-285.6,321.5-288.8,322.2-292,322.2z',
filterMode: 'filter',
},
tooltip: {
trigger: 'axis',
axisPointer: {
type: 'cross',
crossStyle: {
color: '#999'
}
}
},
grid: {
borderWidth: '10',
borderColor : '#eeeeee'
},
legend: {
//selectedMode: false,
//data:['水量','占比']
data:['','']
},
xAxis: [
{
type: 'category',
//显示横坐标中对应值的坐标线(竖线):默认不显示
//splitLine:{show:true},
data: ['1月','2月','3月','4月','5月','6月','7月','8月','9月','10月','11月','12月']
}
,{
type: 'category',
show:false,
boundaryGap : false,
data: ['', '1月','2月','3月','4月','5月','6月','7月','8月','9月','10月','11月','12月']
}
],
yAxis: [
{
type: 'value',
//纵坐标轴上的各个值对应的横线是否显示:默认显示
splitLine:false,
name: '水量',
min: 0,
max: 250,
interval: 50,
axisLabel: {
formatter: '{value} ml'
}
},
{
type: 'value',
name: '占比',
min: 0,
max: 100,
interval: 15,
//纵坐标轴上的各个值对应的横线是否显示:默认显示
splitLine:false,
//splitArea : {show : true}, //保留网格区域
axisLabel: {
formatter: '{value} %'
}
}
],
series: [
{
name:'水量',
type:'bar',
//柱状图之间的空隙为0
barCategoryGap: '0',
//设置柱状图的颜色
itemStyle: {
normal: {
color: function(params) {
var colorList = [
'#5e7e54','#e44f2f','#81b6b2','#eba422','#5e7e54',
'#e44f2f','#81b6b2','#eba422','#5e7e54','#e44f2f','#2e7e04','#e00f2f'
];
return colorList[params.dataIndex]
},
//color: '#5a9bd5',
//设置柱状图边框线颜色
//barBorderColor: 'black',
//设置柱状图边框线的显示宽度
//barBorderWidth:0.2
}
},
data:[15, 10, 9, 8, 8, 8, 8, 8, 8, 7, 6, 5]
},
{
name:'占比',
type:'line',
symbolSize:10,
//显示数字
itemStyle :
{
normal: {
//color:'#f37b1d',
color: function(params) {
var colorList = [
'','#f37b1d','#f37b1d','#f37b1d','#f37b1d',
'#f37b1d','#f37b1d','#f37b1d','#f37b1d',
'red','#f37b1d','#f37b1d',''];
return colorList[params.dataIndex]
},
label :
{
show: true,
//格式化
formatter: '{c}%'
}
}
},
xAxisIndex: 1,
yAxisIndex: 1,
data:[0, 13, 26, 32, 42, 50, 58, 66, 74, 82, 89,95, 100]
}
,
{
type: 'scatter',
xAxisIndex: 1,
yAxisIndex: 1,
data: [[8, 82]],
//symbolSize: 0,
symbol:'none',//去掉箭头
//二八线
markLine: {
itemStyle: {
normal: {
lineStyle: {
color: "#c00",
type: 'dotted', //'dotted'虚线 'solid'实线,默认实线
width: 1
},
label: {
show: true,
//position:'top'
}
},
//圆点加强显示
// emphasis: {
// color: "#d9def7"
// }
},
data: [
//平行于坐标轴和坐标轴等长的二八线
// {
// xAxis:'9月',
// name: '二八竖线',
// label:{
// formatter: '{c}'
// },
// itemStyle: {
// normal: {
// color: "#b84a58"
// }
// }
// }, {
// yAxis: '82',
// name: '二八横线',
// label:{
// formatter: '{c}%'
// },
// itemStyle: {
// normal: {
// color: "#b84a58"
// }
// }
// },
//指定坐标点之间的线
//竖线
[
{
name: '',
xAxis: '9月',
yAxis: 82
},
{
xAxis: '9月',
yAxis: 0
}
],
//横线
[
{
name: '',
xAxis: '9月',
yAxis: 82
},
{
xAxis: '12月',
yAxis: 82
}
]
]
,symbol: ['none', 'none'],
}
}
]
};
三、运行效果:
四、实例运行网址:
https://www.echartsjs.com/examples/editor.html?c=mix-line-bar
五、参照网址:
https://blog.csdn.net/xiaoyu19910321/article/details/78540877
https://blog.csdn.net/luanpeng825485697/article/details/76864440
横向滚动条:https://blog.csdn.net/Arbort_/article/details/80884789

