Python之探索式数据分析
探究数据分析的目的是为了找到有助于清理/准备/转换数据的思路,这些数据最终将用于机器学习算法/模型的建立。我们将采取以下行动:
import numpy as np
import pandas as pd

import matplotlib.pyplot as plt
import seaborn as sns
%matplotlib inline

plt.style.use('bmh')
Seaborn是一个基于matplotlib的Python数据可视化库。它提供了一个绘制信息统计图形的高级界面。
即使是漂亮的图表bokeh。
考虑住房价格及其影响因素。
data = pd.read_csv('data/train.csv')
data.head()
以上为部分数据截图
data.info()RangeIndex: 1460 entries, 0 to 1459 Data columns (total 81 columns): Id 1460 non-null int64 MSSubClass 1460 non-null int64 MSZoning 1460 non-null object LotFrontage 1201 non-null float64 LotArea 1460 non-null int64 Street 1460 non-null object Alley 91 non-null object LotShape 1460 non-null object LandContour 1460 non-null object Utilities 1460 non-null object LotConfig 1460 non-null object LandSlope 1460 non-null object Neighborhood 1460 non-null object Condition1 1460 non-null object Condition2 1460 non-null object BldgType 1460 non-null object HouseStyle 1460 non-null object OverallQual 1460 non-null int64 OverallCond 1460 non-null int64 YearBuilt 1460 non-null int64 YearRemodAdd 1460 non-null int64 RoofStyle 1460 non-null object RoofMatl 1460 non-null object Exterior1st 1460 non-null object Exterior2nd 1460 non-null object MasVnrType 1452 non-null object MasVnrArea 1452 non-null float64 ExterQual 1460 non-null object ExterCond 1460 non-null object Foundation 1460 non-null object BsmtQual 1423 non-null object BsmtCond 1423 non-null object BsmtExposure 1422 non-null object BsmtFinType1 1423 non-null object BsmtFinSF1 1460 non-null int64 BsmtFinType2 1422 non-null object BsmtFinSF2 1460 non-null int64 BsmtUnfSF 1460 non-null int64 TotalBsmtSF 1460 non-null int64 Heating 1460 non-null object HeatingQC 1460 non-null object CentralAir 1460 non-null object Electrical 1459 non-null object 1stFlrSF 1460 non-null int64 2ndFlrSF 1460 non-null int64 LowQualFinSF 1460 non-null int64 GrLivArea 1460 non-null int64 BsmtFullBath 1460 non-null int64 BsmtHalfBath 1460 non-null int64 FullBath 1460 non-null int64 HalfBath 1460 non-null int64 BedroomAbvGr 1460 non-null int64 KitchenAbvGr 1460 non-null int64 KitchenQual 1460 non-null object TotRmsAbvGrd 1460 non-null int64 Functional 1460 non-null object Fireplaces 1460 non-null int64 FireplaceQu 770 non-null object GarageType 1379 non-null object GarageYrBlt 1379 non-null float64 GarageFinish 1379 non-null object GarageCars 1460 non-null int64 GarageArea 1460 non-null int64 GarageQual 1379 non-null object GarageCond 1379 non-null object PavedDrive 1460 non-null object WoodDeckSF 1460 non-null int64 OpenPorchSF 1460 non-null int64 EnclosedPorch 1460 non-null int64 3SsnPorch 1460 non-null int64 ScreenPorch 1460 non-null int64 PoolArea 1460 non-null int64 PoolQC 7 non-null object Fence 281 non-null object MiscFeature 54 non-null object MiscVal 1460 non-null int64 MoSold 1460 non-null int64 YrSold 1460 non-null int64 SaleType 1460 non-null object SaleCondition 1460 non-null object SalePrice 1460 non-null int64 dtypes: float64(3), int64(35), object(43) memory usage: 924.0+ KB
从这些信息中我们已经可以看出,有些数据将与我们的目的无关,因为它包含了太多的NaN值(Drummer、Alley和PoolQC)。此外,即使没有这些数据,表中也有足够的证据进行分析,所以我们可能不会考虑其中的一些数据。让我们去掉变量Id和含有30%以上NaN值的变量。
# pandas.DataFrame.count() does not include NaN values
data_without_nan = data[[column for column in data if data[column].count() / len(data) >= 0.3]]
data_without_nan = data_without_nan.drop(columns=['Id'])

dropped_columns = [col for col in data.columns if col not in data_without_nan.columns ]
print("List of dropped columns: ", dropped_columns)
现在我们来看看房价的分布情况。
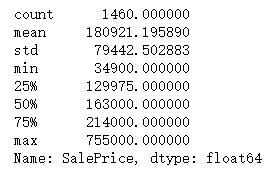
data_without_nan['SalePrice'].describe()# histogram and normal probability plot
from scipy import stats
from scipy.stats import norm
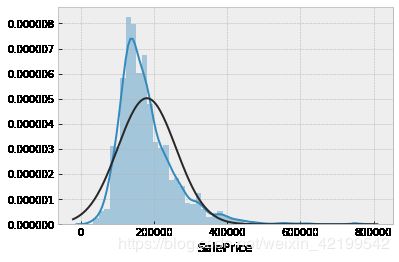
sns.distplot(data_without_nan['SalePrice'], fit=norm);
fig = plt.figure()
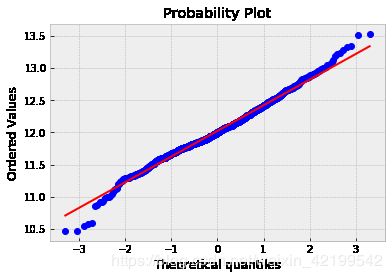
res = stats.probplot(data_without_nan['SalePrice'], plot=plt)
我们可以看到,价格是向右倾斜的,而且有一些排放量在~500000以上。最终,我们将需要摆脱它们,以获得自变量('SalePrice')的正态分布。
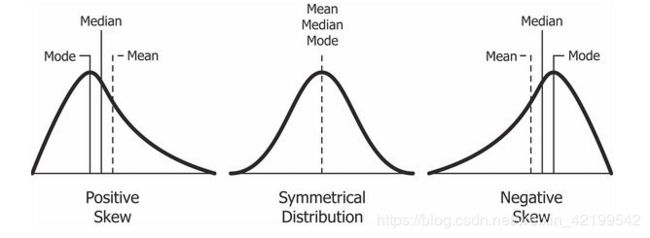
右斜分布有一个长长的右尾。右斜分布也叫正斜分布,因为数值线上有一个正方向的长尾。均值和中位数也是在峰值的右侧。
在偏移量为正值的情况下,数据的对数化效果非常好。
此外,你还可以使用Box-Cox转换。
# transformed histogram and normal probability plot
sns.distplot(np.log(data_without_nan['SalePrice']), fit=norm);
fig = plt.figure()
res = stats.probplot(np.log(data_without_nan['SalePrice']), plot=plt)
我们来看看其他星座的分布情况。要做到这一点,您必须首先只选择数字数据。
list(set(data_without_nan.dtypes.tolist()))![]()
data_without_nan_num = data_without_nan.select_dtypes(include = ['float64', 'int64'])
data_without_nan_num.head()
以下为部分结果截图
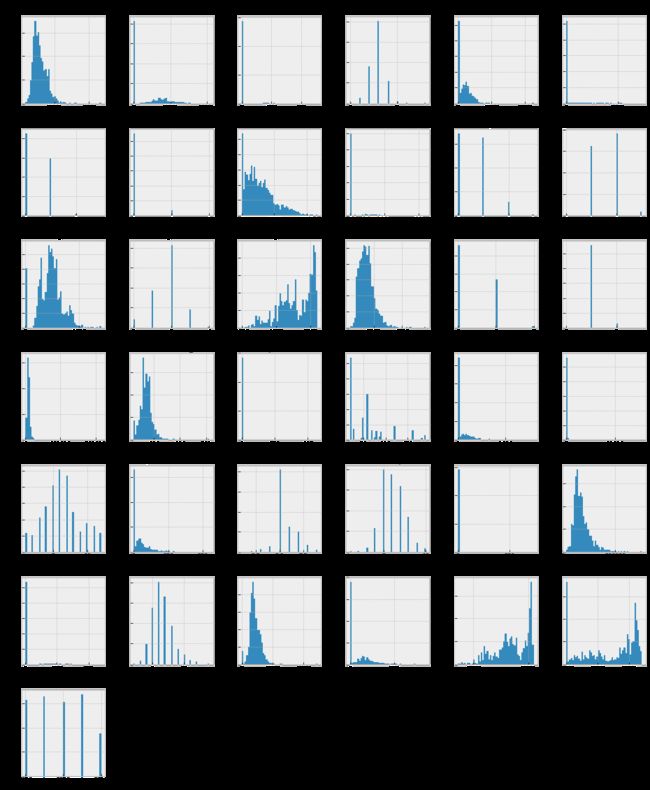
现在让我们把它们都建起来。
data_without_nan_num.hist(figsize=(16, 20), bins=50, xlabelsize=8, ylabelsize=8);
# ; avoid having the matplotlib verbose informations
如 "1stFlrSF"、"TotalBsmtSF"、"LotFrontage"、"GrLiveArea "等功能......。图形上与 "SalePrice "变量的分布相似。
相关性
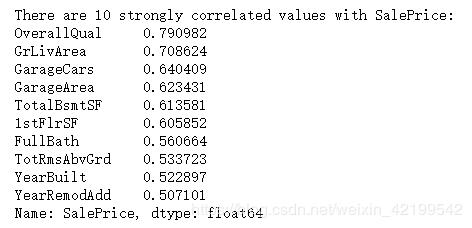
让我们试着找到与 "SalePrice "相关的标志。
corr_data = data_without_nan_num.corr()['SalePrice'][:-1]
correlated_features_list = corr_data[abs(corr_data) > 0.5].sort_values(ascending=False)
print("There are {} strongly correlated values with SalePrice:\n{}".format(len(correlated_features_list),
                                                                          correlated_features_list))
现在,我们有了一份与住房成本相关的变量清单,但这份清单并不完整,因为我们知道,这种相关性取决于排放量。因此,我们可以进行如下操作:
得到一张数字特征图,看看哪些人的排放很少或解释的排放。
删去排放,重新计算相关。
顺便说一下,相关性本身不一定能解释数据之间的关系。例如,比线性关系更复杂的关系,就不能简单地看关联度的值来猜测。所以,我们也来看看我们从关联表中排除的征兆,并建立它们,看看它们和房价之间是否有关联性。
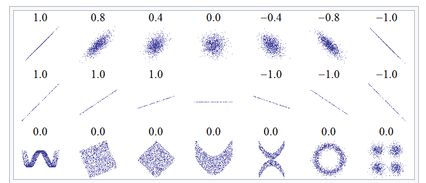
考虑下图中的许多相关领域(Correlation)。值的分布(,),每一个值都有相应的相关系数。相关系数反映了线性依赖关系的 "噪声"(上线),但不能描述线性依赖关系的斜率(中线),完全不适合描述复杂的非线性依赖关系(下线)。对于图中所示的分布,由于离散度y为零,所以没有定义相关系数。
for i in range(0, len(data_without_nan_num.columns), 5):
    sns.pairplot(data=data_without_nan_num,
                x_vars=data_without_nan_num.columns[i:i+5],
                y_vars=['SalePrice'])
我们可以清楚地发现这些迹象之间的一些联系。它们中的大多数似乎与 "SalePrice "有线性联系,如果你仔细观察数据,你会发现许多数据点位于x=0,这可能表明在特定的房屋中没有这样的调查特征(例如,"OpenPorchSF"--存在一个开放的门廊)。
我们试着把这些0从数值中去掉,重复寻找与房价最相关的数值。
import operator

individual_features_df = []
for i in range(0, len(data_without_nan_num.columns) - 1): # -1 because the last column is SalePrice
    tmp_data = data_without_nan_num[[data_without_nan_num.columns[i], 'SalePrice']]
    tmp_data = tmp_data[tmp_data[data_without_nan_num.columns[i]] != 0]
    individual_features_df.append(tmp_data)

all_correlations = {feature.columns[0]: feature.corr()['SalePrice'][0] for feature in individual_features_df}
all_correlations = sorted(all_correlations.items(), key=operator.itemgetter(1))
for (key, value) in all_correlations:
    print("{:>15}: {:>15}".format(key, value))
还有一个与 "SalePrice "相关的标志--"2ndFlrSF"。
correlated_features_list = [key for key, value in all_correlations if abs(value) >= 0.5]
print("There is {} strongly correlated values with SalePrice:\n{}".format(len(correlated_features_list),
                                                                          correlated_features_list))
因此,有11个预测因素与 "SalePrice "相关。
我们还可以为我们暂时排除在考虑范围之外的分类特征引入额外的虚拟变量。
符号'2ndFlrSF'(有很多零)也可以通过标记1它的存在使其分类,数值可以加到变量'1stFlrSF'中。
data_without_nan_num[['1stFlrSF', '2ndFlrSF']]| 1stFlrSF | 2ndFlrSF | |
|---|---|---|
| 0 | 856 | 854 |
| 1 | 1262 | 0 |
| 2 | 920 | 866 |
| 3 | 961 | 756 |
| 4 | 1145 | 1053 |
| 5 | 796 | 566 |
| 6 | 1694 | 0 |
| 7 | 1107 | 983 |
| 8 | 1022 | 752 |
| 9 | 1077 | 0 |
| 10 | 1040 | 0 |
| 11 | 1182 | 1142 |
| 12 | 912 | 0 |
| 13 | 1494 | 0 |
| 14 | 1253 | 0 |
| 15 | 854 | 0 |
| 16 | 1004 | 0 |
| 17 | 1296 | 0 |
| 18 | 1114 | 0 |
| 19 | 1339 | 0 |
| 20 | 1158 | 1218 |
| 21 | 1108 | 0 |
| 22 | 1795 | 0 |
| 23 | 1060 | 0 |
| 24 | 1060 | 0 |
| 25 | 1600 | 0 |
| 26 | 900 | 0 |
| 27 | 1704 | 0 |
| 28 | 1600 | 0 |
| 29 | 520 | 0 |
| ... | ... | ... |
| 1430 | 734 | 1104 |
| 1431 | 958 | 0 |
| 1432 | 968 | 0 |
| 1433 | 962 | 830 |
| 1434 | 1126 | 0 |
| 1435 | 1537 | 0 |
| 1436 | 864 | 0 |
| 1437 | 1932 | 0 |
| 1438 | 1236 | 0 |
| 1439 | 1040 | 685 |
| 1440 | 1423 | 748 |
| 1441 | 848 | 0 |
| 1442 | 1026 | 981 |
| 1443 | 952 | 0 |
| 1444 | 1422 | 0 |
| 1445 | 913 | 0 |
| 1446 | 1188 | 0 |
| 1447 | 1220 | 870 |
| 1448 | 796 | 550 |
| 1449 | 630 | 0 |
| 1450 | 896 | 896 |
| 1451 | 1578 | 0 |
| 1452 | 1072 | 0 |
| 1453 | 1140 | 0 |
| 1454 | 1221 | 0 |
| 1455 | 953 | 694 |
| 1456 | 2073 | 0 |
| 1457 | 1188 | 1152 |
| 1458 | 1078 | 0 |
| 1459 | 1256 | 0 |
1460 rows × 2 columns
特征与特征间的关系
让我们看看变量之间的关系,而不是与 "SalePrice "的关系。
corr = data_without_nan_num.drop('SalePrice', axis=1).corr() # We've already examined SalePrice correlations
plt.figure(figsize=(12, 10))

sns.heatmap(corr[(corr >= 0.5) | (corr <= -0.4)],
            cmap='viridis', vmax=1.0, vmin=-1.0, linewidths=0.1,
            annot=True, annot_kws={"size": 8}, square=True);
很多因素是相互关联的。
一些因素,如YearBuild/GarageYrBlt,可能只是表明一段时间内的价格上涨。至于1stFlrSF/TotalBsmtSF这一对的相关性,似乎符合逻辑,1楼越大(考虑到很多房子只有1楼),普通的地下室就越大。这对于GarageCars/GarageArea对来说也是一样的。
因此,对于强相关的特征(1FlrSF/TotalBsmtSF,GarageCars/GarageArea),只包含其中的一对是有意义的。
Q -> Q (Quantitative to Quantitative relationship)
除了按数据类型选择外,还可以查看数据描述(如果有的话),并选择严格的定量特征来查看数据和因变量之间的关系。
quantitative_features_list = ['LotFrontage', 'LotArea', 'MasVnrArea', 'BsmtFinSF1', 'BsmtFinSF2', 'TotalBsmtSF', '1stFlrSF',
    '2ndFlrSF', 'LowQualFinSF', 'GrLivArea', 'BsmtFullBath', 'BsmtHalfBath', 'FullBath', 'HalfBath',
    'BedroomAbvGr', 'KitchenAbvGr', 'TotRmsAbvGrd', 'Fireplaces', 'GarageCars', 'GarageArea', 'WoodDeckSF', 'OpenPorchSF',
    'EnclosedPorch', '3SsnPorch', 'ScreenPorch', 'PoolArea', 'MiscVal', 'SalePrice']
df_quantitative_values = data_without_nan[quantitative_features_list]
df_quantitative_values.head()| LotFrontage | LotArea | MasVnrArea | BsmtFinSF1 | BsmtFinSF2 | TotalBsmtSF | 1stFlrSF | 2ndFlrSF | LowQualFinSF | GrLivArea | ... | GarageCars | GarageArea | WoodDeckSF | OpenPorchSF | EnclosedPorch | 3SsnPorch | ScreenPorch | PoolArea | MiscVal | SalePrice | |
|---|---|---|---|---|---|---|---|---|---|---|---|---|---|---|---|---|---|---|---|---|---|
| 0 | 65.0 | 8450 | 196.0 | 706 | 0 | 856 | 856 | 854 | 0 | 1710 | ... | 2 | 548 | 0 | 61 | 0 | 0 | 0 | 0 | 0 | 208500 |
| 1 | 80.0 | 9600 | 0.0 | 978 | 0 | 1262 | 1262 | 0 | 0 | 1262 | ... | 2 | 460 | 298 | 0 | 0 | 0 | 0 | 0 | 0 | 181500 |
| 2 | 68.0 | 11250 | 162.0 | 486 | 0 | 920 | 920 | 866 | 0 | 1786 | ... | 2 | 608 | 0 | 42 | 0 | 0 | 0 | 0 | 0 | 223500 |
| 3 | 60.0 | 9550 | 0.0 | 216 | 0 | 756 | 961 | 756 | 0 | 1717 | ... | 3 | 642 | 0 | 35 | 272 | 0 | 0 | 0 | 0 | 140000 |
| 4 | 84.0 | 14260 | 350.0 | 655 | 0 | 1145 | 1145 | 1053 | 0 | 2198 | ... | 3 | 836 | 192 | 84 | 0 | 0 | 0 | 0 | 0 | 250000 |
5 rows × 28 columns
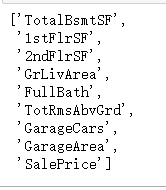
让我们挑出与房价相关性最大的因素。
features_to_analyse = [x for x in quantitative_features_list if x in correlated_features_list]
features_to_analyse.append('SalePrice')
features_to_analyse
我们来看看所选数据的回归图。
fig, ax = plt.subplots(round(len(features_to_analyse) / 3), 3, figsize = (18, 12))

for i, ax in enumerate(fig.axes):
    if i < len(features_to_analyse) - 1:
        sns.regplot(x=features_to_analyse[i], y='SalePrice', data=data_without_nan[features_to_analyse], ax=ax)
TotalBsmtSF、1stFlrSF(之前我们已经决定用2ndFlrSF进行总结,并为2ndFlrSF进入类别变量)、GrLivArea和GarageArea适合在定量变量中建立模型。
C -> Q (Categorical to Quantitative relationship)
让我们来看看断然的特征。
# quantitative_features_list[:-1] as the last column is SalePrice and we want to keep it
categorical_features = [a for a in quantitative_features_list[:-1] +
                        data_without_nan.columns.tolist() if (a not in quantitative_features_list[:-1]) or
                        (a not in data_without_nan.columns.tolist())]
df_categ = data_without_nan[categorical_features]
df_categ.head()| MSSubClass | MSZoning | Street | LotShape | LandContour | Utilities | LotConfig | LandSlope | Neighborhood | Condition1 | ... | GarageYrBlt | GarageFinish | GarageQual | GarageCond | PavedDrive | MoSold | YrSold | SaleType | SaleCondition | SalePrice | |
|---|---|---|---|---|---|---|---|---|---|---|---|---|---|---|---|---|---|---|---|---|---|
| 0 | 60 | RL | Pave | Reg | Lvl | AllPub | Inside | Gtl | CollgCr | Norm | ... | 2003.0 | RFn | TA | TA | Y | 2 | 2008 | WD | Normal | 208500 |
| 1 | 20 | RL | Pave | Reg | Lvl | AllPub | FR2 | Gtl | Veenker | Feedr | ... | 1976.0 | RFn | TA | TA | Y | 5 | 2007 | WD | Normal | 181500 |
| 2 | 60 | RL | Pave | IR1 | Lvl | AllPub | Inside | Gtl | CollgCr | Norm | ... | 2001.0 | RFn | TA | TA | Y | 9 | 2008 | WD | Normal | 223500 |
| 3 | 70 | RL | Pave | IR1 | Lvl | AllPub | Corner | Gtl | Crawfor | Norm | ... | 1998.0 | Unf | TA | TA | Y | 2 | 2006 | WD | Abnorml | 140000 |
| 4 | 60 | RL | Pave | IR1 | Lvl | AllPub | FR2 | Gtl | NoRidge | Norm | ... | 2000.0 | RFn | TA | TA | Y | 12 | 2008 | WD | Normal | 250000 |
5 rows × 49 columns
df_not_num = df_categ.select_dtypes(include = ['O'])
print('There is {} non numerical features including:\n{}'.format(len(df_not_num.columns), df_not_num.columns.tolist()))
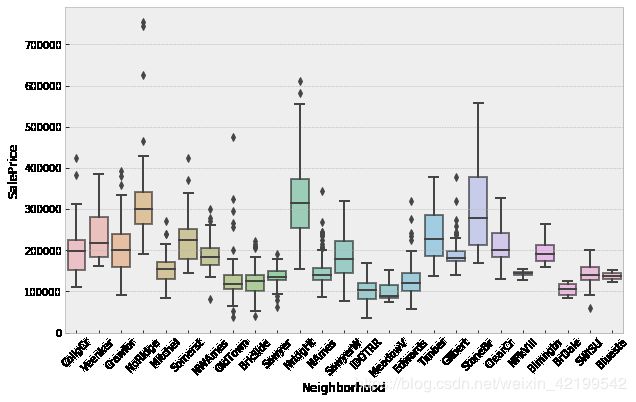
让我们来看看特征
plt.figure(figsize = (10, 6))
ax = sns.boxplot(x='Neighborhood', y='SalePrice', data=df_categ)
plt.setp(ax.artists, alpha=.5, linewidth=2, edgecolor="k")
plt.xticks(rotation=45)
plt.figure(figsize = (12, 6))
ax = sns.boxplot(x='HouseStyle', y='SalePrice', data=df_categ)
plt.setp(ax.artists, alpha=.5, linewidth=2, edgecolor="k")
plt.xticks(rotation=45)(array([0, 1, 2, 3, 4, 5, 6, 7]), )
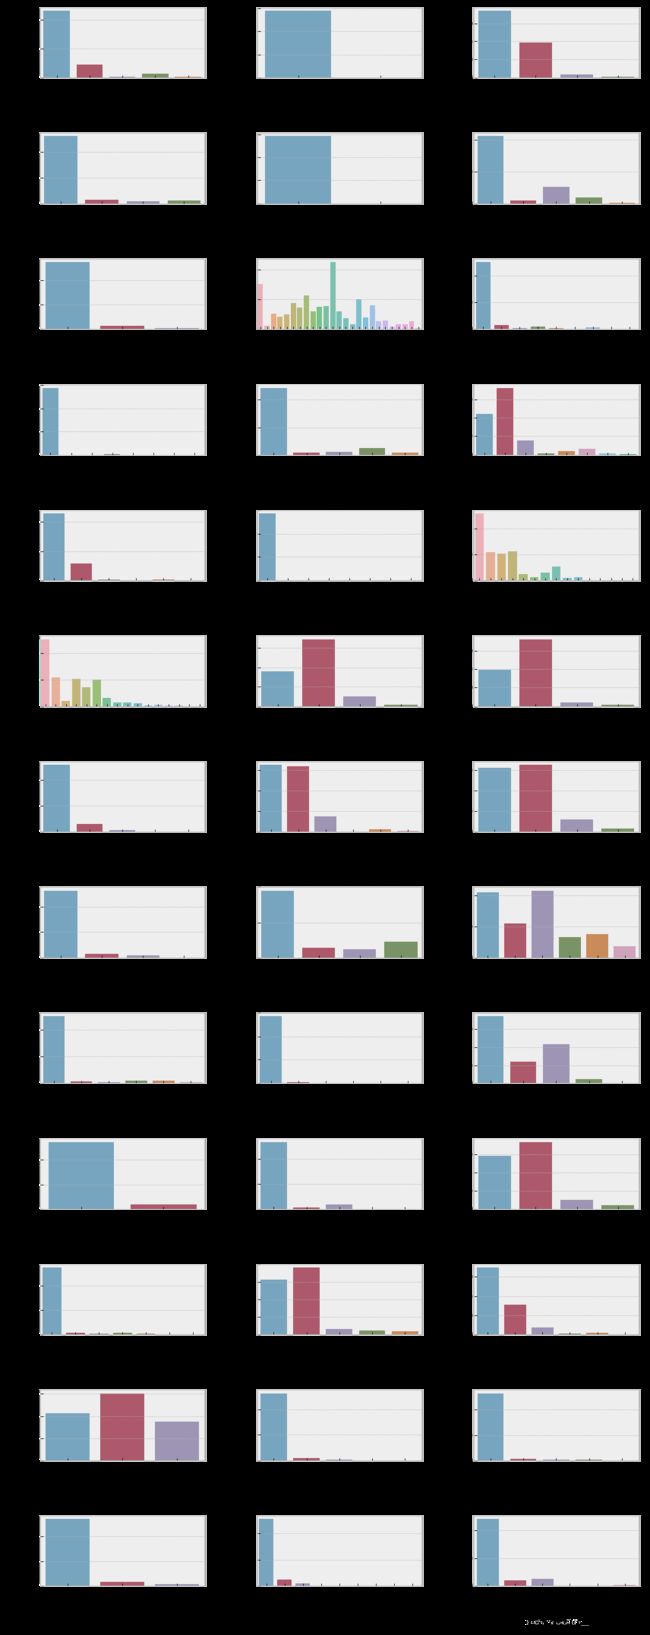
让我们来看看它们的分布情况。
fig, axes = plt.subplots(round(len(df_not_num.columns) / 3), 3, figsize=(12, 30))

for i, ax in enumerate(fig.axes):
    if i < len(df_not_num.columns):
        ax.set_xticklabels(ax.xaxis.get_majorticklabels(), rotation=45)
        sns.countplot(x=df_not_num.columns[i], alpha=0.7, data=df_not_num, ax=ax)  # bar plots showing the counts of observations in each categorical bin

fig.tight_layout()
你可以看到,对于一些属性(Utilities、Heating、GarageCond、Functional)来说,有一个值是主要的。这些特征不携带进一步建模的信息。
用分类特征工作
替换值
编码标签Encoding labels
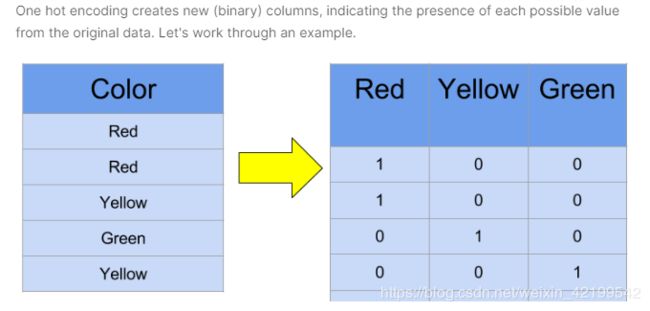
一热编码One-Hot encoding
二进制编码Binary encoding
后向差异编码Backward difference encoding
杂项特征Miscellaneous features
# convert categorical variable into dummy
data_with_dummies = pd.get_dummies(data_without_nan.dropna())
data_with_dummies.head()| MSSubClass | LotFrontage | LotArea | OverallQual | OverallCond | YearBuilt | YearRemodAdd | MasVnrArea | BsmtFinSF1 | BsmtFinSF2 | ... | SaleType_ConLD | SaleType_ConLI | SaleType_ConLw | SaleType_New | SaleType_WD | SaleCondition_Abnorml | SaleCondition_Alloca | SaleCondition_Family | SaleCondition_Normal | SaleCondition_Partial | |
|---|---|---|---|---|---|---|---|---|---|---|---|---|---|---|---|---|---|---|---|---|---|
| 1 | 20 | 80.0 | 9600 | 6 | 8 | 1976 | 1976 | 0.0 | 978 | 0 | ... | 0 | 0 | 0 | 0 | 1 | 0 | 0 | 0 | 1 | 0 |
| 2 | 60 | 68.0 | 11250 | 7 | 5 | 2001 | 2002 | 162.0 | 486 | 0 | ... | 0 | 0 | 0 | 0 | 1 | 0 | 0 | 0 | 1 | 0 |
| 3 | 70 | 60.0 | 9550 | 7 | 5 | 1915 | 1970 | 0.0 | 216 | 0 | ... | 0 | 0 | 0 | 0 | 1 | 1 | 0 | 0 | 0 | 0 |
| 4 | 60 | 84.0 | 14260 | 8 | 5 | 2000 | 2000 | 350.0 | 655 | 0 | ... | 0 | 0 | 0 | 0 | 1 | 0 | 0 | 0 | 1 | 0 |
| 6 | 20 | 75.0 | 10084 | 8 | 5 | 2004 | 2005 | 186.0 | 1369 | 0 | ... | 0 | 0 | 0 | 0 | 1 | 0 | 0 | 0 | 1 | 0 |
5 row
| MSSubClass | MSZoning | LotFrontage | LotArea | Street | LotShape | LandContour | Utilities | LotConfig | LandSlope | ... | EnclosedPorch | 3SsnPorch | ScreenPorch | PoolArea | MiscVal | MoSold | YrSold | SaleType | SaleCondition | SalePrice | |
|---|---|---|---|---|---|---|---|---|---|---|---|---|---|---|---|---|---|---|---|---|---|
| 0 | 60 | RL | 65.0 | 8450 | Pave | Reg | Lvl | AllPub | Inside | Gtl | ... | 0 | 0 | 0 | 0 | 0 | 2 | 2008 | WD | Normal | 208500 |
| 1 | 20 | RL | 80.0 | 9600 | Pave | Reg | Lvl | AllPub | FR2 | Gtl | ... | 0 | 0 | 0 | 0 | 0 | 5 | 2007 | WD | Normal | 181500 |
| 2 | 60 | RL | 68.0 | 11250 | Pave | IR1 | Lvl | AllPub | Inside | Gtl | ... | 0 | 0 | 0 | 0 | 0 | 9 | 2008 | WD | Normal | 223500 |
| 3 | 70 | RL | 60.0 | 9550 | Pave | IR1 | Lvl | AllPub | Corner | Gtl | ... | 272 | 0 | 0 | 0 | 0 | 2 | 2006 | WD | Abnorml | 140000 |
| 4 | 60 | RL | 84.0 | 14260 | Pave | IR1 | Lvl | AllPub | FR2 | Gtl | ... | 0 | 0 | 0 | 0 | 0 | 12 | 2008 | WD | Normal | 250000 |
5 rows × 76 columns
data_without_nan.head()| MSSubClass | MSZoning | LotFrontage | LotArea | Street | LotShape | LandContour | Utilities | LotConfig | LandSlope | ... | EnclosedPorch | 3SsnPorch | ScreenPorch | PoolArea | MiscVal | MoSold | YrSold | SaleType | SaleCondition | SalePrice | |
|---|---|---|---|---|---|---|---|---|---|---|---|---|---|---|---|---|---|---|---|---|---|
| 0 | 60 | RL | 65.0 | 8450 | Pave | Reg | Lvl | AllPub | Inside | Gtl | ... | 0 | 0 | 0 | 0 | 0 | 2 | 2008 | WD | Normal | 208500 |
| 1 | 20 | RL | 80.0 | 9600 | Pave | Reg | Lvl | AllPub | FR2 | Gtl | ... | 0 | 0 | 0 | 0 | 0 | 5 | 2007 | WD | Normal | 181500 |
| 2 | 60 | RL | 68.0 | 11250 | Pave | IR1 | Lvl | AllPub | Inside | Gtl | ... | 0 | 0 | 0 | 0 | 0 | 9 | 2008 | WD | Normal | 223500 |
| 3 | 70 | RL | 60.0 | 9550 | Pave | IR1 | Lvl | AllPub | Corner | Gtl | ... | 272 | 0 | 0 | 0 | 0 | 2 | 2006 | WD | Abnorml | 140000 |
| 4 | 60 | RL | 84.0 | 14260 | Pave | IR1 | Lvl | AllPub | FR2 | Gtl | ... | 0 | 0 | 0 | 0 | 0 | 12 | 2008 | WD | Normal | 250000 |
5 rows × 76 columns
变量选择
因此,在NaN的清洗阶段,所有迹象都被过滤掉了,除了: 巷子里的游泳池QC围栏MiscFeature.
经过定量特征的图形分析,看到了最适合进一步建立模型。1stFlrSF GarageArea GrLivArea LotFrontage TotalBsmtSF
通过与被调查变量SalePrice的相关性:OverallQual GrLivArea 2ndFlrSF。
根据各变量之间的相关性,有必要取其一FlrSF或TotalBsmtSF进行分析(相关系数0.82)。
按回归图:TotalBsmtSF GrLivArea 1stFlrSF GarageArea
其中优质功能:邻里外景1st / Exterior2nd HouseStyle BsmtFinType1。
最后一组:1stFlrSF(或TotalBsmtSF)、GarageArea、GrLivArea、LotFrontage、OverallQual(意义更大)、2ndFlrSF(可能要分类修改)、Neighborhood、Exterior1st(或Exterior2nd)、HouseStyle和BsmtFinType1。


