利用Jmetal解决多目标优化问题并使用python画图(算法:NSGA-II,问题:ZDT6)
1.使用jmetal实现算法的方法:
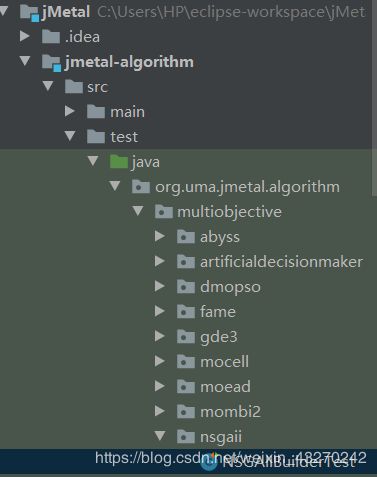
首先在Jmetal体系框架中在jmetal-algorithm文件中选择src文件,再从src文件中选择test文件,点开其中的java文件,再继续向下点击,找到multiobjective与singleobjective两个文件,这两个文件分别是多目标优化算法与单目标优化算法,从这两个文件中找到你需要的对应文件,例如我们需要的是NSGA2,那我们便打开nsgaii文件夹下面的NSGAIIBuilderTest测试类(顺序如下图:)
打开对应的测试类,我们会看到一堆方法(感觉NSGAII是方法最多的,而且看起来极为劝退),在这里我们只需要关注开始(startup方法)与其他的set方法,通过分析这些方法,我们可以知道NSGAII在Jmetal算法实现中需要的众多算子,譬如说 problem问题集,CrossoverOperator交叉算子运算符,MutationOperator变异算子运算符,SelectionOperator选择算子运算符(在setNewSelectionOperator中),还有相应的builder算法(builder的作用就是建立算法,所以我们可以直接使用algorithm算法类来代替),然后我们便可以构建我们自己的test类了(以下的代码由一个大佬的博客抄来的,但我忘了从哪抄的了,尴尬。。。)
public class test {
    public static void main(String[] args) {
        Problem<DoubleSolution> problem;//问题类
        Algorithm<List<DoubleSolution>> algorithm;//算法类
        CrossoverOperator<DoubleSolution> crossover;//交叉算子类
        MutationOperator<DoubleSolution> mutation;//变异算子类
        SelectionOperator<List<DoubleSolution>, DoubleSolution> selection;//选择算子类


        // 这里是定义优化问题的过程

        problem = new ZDT6();//声明问题,换成其他问题同理
        String s="NSGA"+problem.getName();//这里构建了一个字符串,接下来文件中使用
        //以下的参数设置都是根据test类中来构建的,但是在自己使用时可以调节参数使算法表现更好
        // 种群规模
        int popSize = 100;
        // 配置SBX交叉算子
        double crossoverProbability = 0.9;
        double crossoverDistributionIndex = 20.0;
        crossover = new SBXCrossover(crossoverProbability, crossoverDistributionIndex);
        // 配置变异算子
        double mutationProbability = 1.0 / problem.getNumberOfVariables();
        double mutationDistributionIndex = 20.0;
        mutation = new PolynomialMutation(mutationProbability, mutationDistributionIndex);
        // 配置选择算子
        selection = new BinaryTournamentSelection<DoubleSolution>(
                new RankingAndCrowdingDistanceComparator<DoubleSolution>());
        //这里使用了builder算子来构建algorithm,
        //如果对算法的参数仍然有问题的话,可以去算法的builder算子中直接查看
        // 将组件注册到algorithm
        algorithm = new NSGAIIBuilder<DoubleSolution>(problem, crossover, mutation, popSize)
                .setSelectionOperator(selection).setMaxEvaluations(25000).build();

        // 用AlgorithmRunner运行算法

        AlgorithmRunner algorithmRunner = new AlgorithmRunner.Executor((Algorithm<?>) algorithm).execute();


        // 获取结果集

        List<DoubleSolution> population = algorithm.getResult();
        // 输出结果
        long computingTime = algorithmRunner.getComputingTime();
        JMetalLogger.logger.info("Total execution time: " + computingTime + "ms");
        printFinalSolutionSet(population,s);
    }


    /**

     * 输出最后的种群中的各个解的适应度

     *

     * @param population

     */

    private static void printFinalSolutionSet(List<DoubleSolution> population,String s) {
        //将我们得到的数据写入到文件当中
        try {
            String Filename="D:/"+s+".txt";
            File file = new File(Filename);
            file.createNewFile();//创建文件
            FileWriter out=new FileWriter(file);
            BufferedWriter o=new BufferedWriter(out);
            //System.out.println("-------------------------------");
            for (DoubleSolution p : population) {
                o.write(p.getObjectives()[0]+" "+p.getObjectives()[1]);
                //注意这里的文件输出格式是以python中numpy的loadtext方法能够读取为标准的,最好不要修改
                o.newLine();
            }

            o.close();

        } catch (Exception e) {
            e.printStackTrace();
        }

        for (DoubleSolution p : population) {
            System.out.println("["+p.getObjectives()[0]+","+p.getObjectives()[1]+"]");
            //将数据输出在控制台上,这个数据可以作为Echarts的数据格式进行使用
        }


    }


}
以上这些,就是使用jmetal算法进行构建多目标优化算法解决问题的方式,如果要是想采用其他算子,只需对照Jmetal体系中的相应的builderTest其中所采用的参数,继续构建自己的测试类,然后利用builder算子构建算法,Runner算子进行运行就可以了。(有一些算法的测试类是以T的形式表示的,憋问我,我也不知道为啥,哈哈哈菜鸡本鸡)
2.利用python进行画图
这里是采用numpy和matlotlib包来实现数据画图
修改自定义视图的属性
figure()方法可以用来构建画布,
scatter()方法用来设置浮点图,marker属性表示浮点的样式,c属性表示颜色,s表示大小,edgecolor表示是否存在边缘色
title方法用来设置图的标题,family表示标题所采用的字体
tick_params用来设置坐标轴的格式,labelsize表示坐标轴所显示数字的大小,下面的set_fontname则是用来设置坐标轴显示数字的格式
xlim与ylim则是用来表示图像显示的xy轴的取值范围
savefig方法用来存储,dpi表示的像素点的多少,数值越多我们得到的图像也就越清晰
show方法表示将图像显示在控制台上。
import numpy as np
import matplotlib.pyplot as plt
from matplotlib.pyplot import MultipleLocator
plt.rcParams['font.sans-serif'] = 'times new roma ' ## 设置字体形式

plt.rcParams['axes.unicode_minus'] = False
p = plt.figure(figsize=(1.0, 2.0)) ##设置画布
ax1 = p.add_subplot(2,1,1)##添加子图
file_name = 'D:\\NSGAZDT6.txt'
##从文件中读取数据的步骤
a = np.loadtxt(file_name)
##将txt文件读为numpy数组的形式
##plt.legend("NSGA2 on ZDT6")##添加图例的选项
plt.scatter(a[:,0],a[:,1], marker='o',c='pink',s=3,edgecolor='none') ## 绘制散点
plt.title('ZDT6',fontsize='8',family='Times New Roman') ## 添加图表标题
plt.tick_params(axis='both',which='major',labelsize=8)##坐标轴属性的设置
plt.xlim(0,1.0)##x轴的取值范围
plt.ylim(0,1.0)##y轴的取值范围
labels = ax1.get_xticklabels() + ax1.get_yticklabels()
[label.set_fontname('Times New Roman') for label in labels]##坐标轴字体的设置
plt.savefig(r"D:\ZDT6.png",dpi=1000,bbox_inches='tight')##保存图片的过程
plt.show()