原文:
http://help.eclipse.org/mars/index.jsp?topic=%2Forg.eclipse.mat.ui.help%2Fgettingstarted%2Fbasictutorial.html
Basic Tutorial
This tutorial provides a "jumping-off place" to get familiar with Memory Analyzer.
基本操作如下:
-
Step 1 - Getting a Heap Dump 创建 .hprof文件
-
Step 2 - The Overview 概况
-
Step 3 - The Histogram 柱状图查看某个类分配的对象数,注意要手动计算一次
-
Step 4 - The Dominator Tree 对象控制者树查看 对象控制关系
- Step 5 - Path to GC Roots 查看被root gc 管理的对象
-
Step 6 - The Leak Report 查看内存泄漏
Step 1 - Getting a Heap Dump 创建 .hprof文件
The Memory Analyzer works with heap dumps . Such a heap dump contains information about all Java objects alive at a given point in time. All current Java Virtual Machines can write heap dumps, but the exact steps depend on vendor, version and operation system. Find out more in the section Acquiring Heap Dumps .
Open ![]() a sample heap dump if you view this page inside the Eclipse help center.
a sample heap dump if you view this page inside the Eclipse help center.
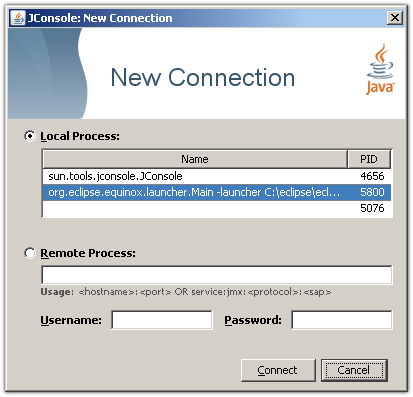
For the purpose of this tutorial, we use Java 6 and JConsole on Windows. Start your application with Java 6, then start
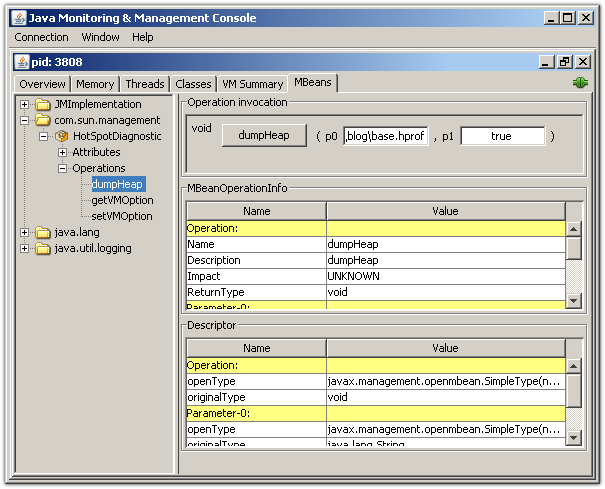
Then, select the operation dumpHeap from the com.sun.management.HotSpotDiagnostic MBean. The first parameter p0 is the full path to the heap dump file. Make sure you give it the file extension .hprof. The second parameter p1 should be left at true as we are only interested in live objects.
Step 2 - The Overview 概况
Open the heap dump via
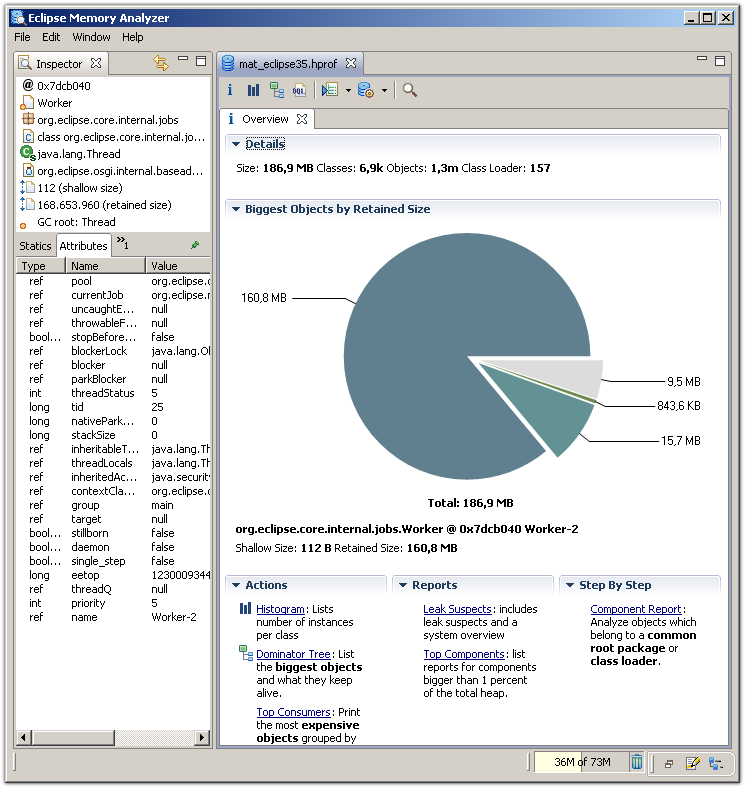
On the right, you'll find the size of the dump and the number of classes, objects and class loaders.
Right below, the pie chart gives an impression on the biggest objects in the dump. Move your mouse over a slice to see the details of the objects in the object inspector on the left. Click on any slice to drill down and follow for example the outgoing references.
Step 3 - The Histogram 柱状图查看某个类分配的对象数,注意要手动计算一次
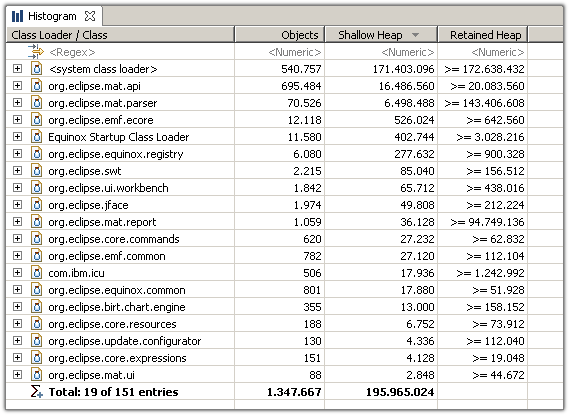
Select the histogram from the tool bar to list the number of instances per class, the shallow size and the retained size .
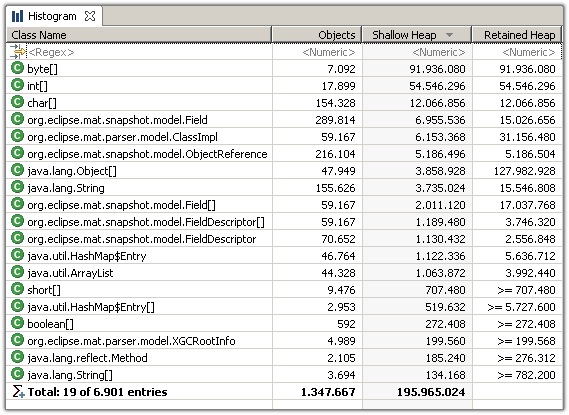
The Memory Analyzer displays by default the retained size of individual objects. However, the retained size of a set of objects - in this case all instances of a particular class - needs to be calculated.
在用mat分析 retained size 大小时,要手动计算一次。如下:
To approximate the retained sizes for all rows, pick ![]() icon from the tool bar. Alternatively, select a couple rows and use the context menu.
icon from the tool bar. Alternatively, select a couple rows and use the context menu.

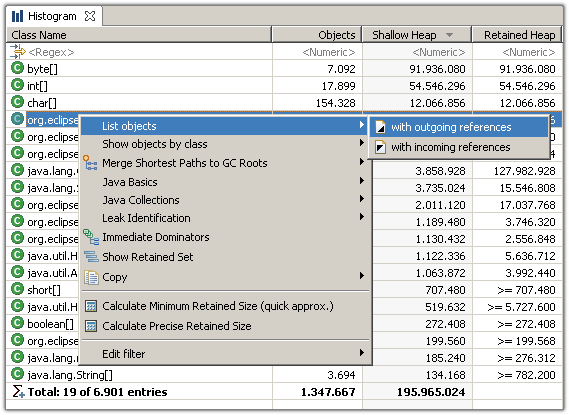
Using the context menu , you can drill-down into the set of objects which the selected row represents. For example, you can list the objects with outgoing or incoming references. Or group the objects by the value of an attribute. Or group the collections by their size. Or or or...
One thing that makes the Memory Analyzer so powerful is the fact that one can run any action on any set of objects. Just drill down and slice your objects the way you need them.
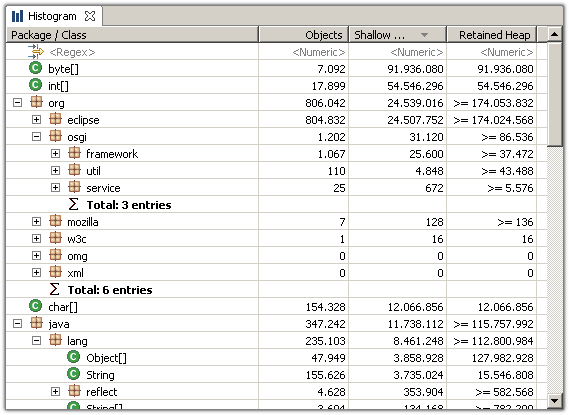
Another important feature is the facility to group any histogram by class loader, packages or superclass .
More: Analyze Class Loader
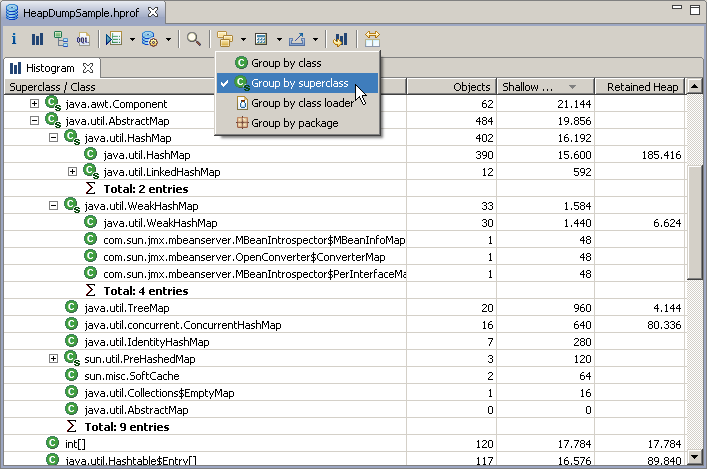
Grouping the histogram by superclass provides an easy way to find for example all the subclasses of java.util.AbstractMap, etc...
Step 4 - The Dominator Tree 对象控制者树查看 对象控制关系
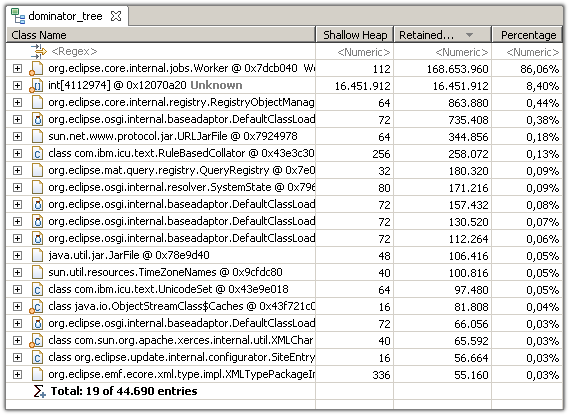
The dominator tree displays the biggest objects in the heap dump. The next level of the tree lists those objects that would be garbage collected if all incoming references to the parent node were removed.
The dominator tree is a powerful tool to investigate which objects keep which other objects alive. Again, the tree can be grouped by class loader (e.g. components) and packages to ease the analysis.
Step 5 - Path to GC Roots 查看被root gc 管理的对象
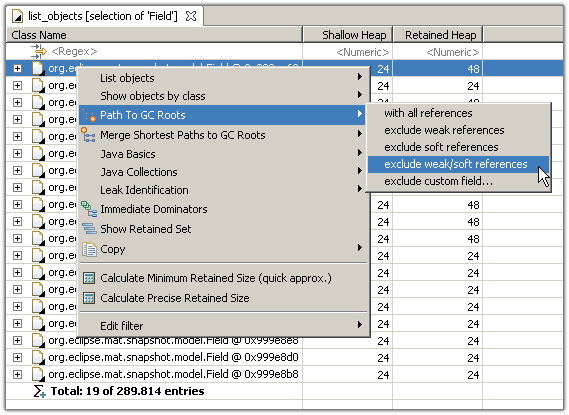
Garbage Collections Roots (GC roots) are objects that are kept alive by the Virtual Machines itself. These include for example the thread objects of the threads currently running, objects currently on the call stack and classes loaded by the system class loader.
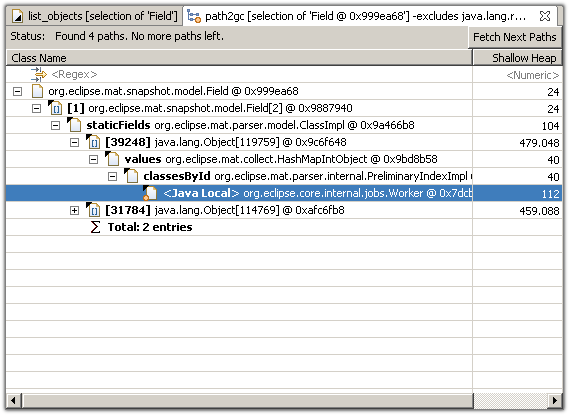
The (reverse) reference chain from an object to a GC root - the so called path to GC roots - explains why the object cannot be garbage collected. The path helps solving the classical memory leak in Java: those leaks exist because an object is still referenced even though the program logic will not access the object anymore.
Initially, the GC root reached by the shortest path is selected.
Step 6 - The Leak Report 查看内存泄漏
The Memory Analyzer can inspect the heap dump for leak suspects, e.g. objects or set of objects which are suspiciously big.

Learn more in this blog posting: Automated Heap Dump Analysis: Finding Memory Leaks with One Click .

