停车场车位识别 opencv(一)----数据处理
停车场车位识别,opencv图像预处理,训练网络模型
项目理论和源码来自唐宇迪opencv项目实战
本项目的目的是设计一个停车场车位识别的系统,能够判断出当前停车场中哪些车位是空的。
任务共包含部分:
1.制作数据集,从停车场的监控视频中提取图片,使用数字图像处理技术制作数据集。
2.利用上一步制作的数据集,训练神经网络模型,能够识别停车场中有哪些剩余车位。
1 数字数字图像处理 opencv
- 从视频中截取图片,即对视频图片逐帧保存。
- 对图片进行一系列的预处理,去噪、识别图像中的车位、定位停车位的轮廓
- 提取每个停车位区域的图片并保存到指定的数据文件路径。
(1)从视频中截取图片
程序代码
import cv2
import numpy as np

def save_image(image, addr, num):
    address = addr + str(num) + '.jpeg'
    cv2.imwrite(address, image)
videoCapture = cv2.VideoCapture("path/.mp4")
success, frame = videoCapture.read()
i = 0
while success:
    i = i + 1
    save_image(frame, './output/img_', i)
    if success:
        print('save image:', i)
    success, frame = videoCapture.read()
本实例中我们使用其中的两张图片。
(2)显示指定路径下的两张图片
用matplotlib显示图片
matplotlib官方文档
对于三通道的彩色图像, plt的三通道的顺序是RGB
而opencv的三个通道顺序是BGR。
显示路径下这两张图片
程序:
    def show_images(self, images, cmap = None):
        # 文件夹中有多少张图片,用plt在同一幅画面中显示
        cols = 2
        rows = (len(images)+1)//cols
		# 图像的宽和高,单位是英寸
        plt.figure(figsize=(15, 12))
        # 遍历路径下的每一张图片
        for i, image in enumerate(images):
            plt.subplot(rows, cols, i+1)
            cmap = 'gray' if len(image.shape) == 2 else cmap
            plt.imshow(image, cmap=cmap)
            plt.xticks([])
            plt.yticks([])
        plt.tight_layout(pad=0, h_pad=0, w_pad=0)
        plt.show()
结果:
(3)滤除其他区域
我们关心的只有图像中停车部分的信息,对于本实例中的图片,左上角区域是可以滤除掉的。于是我们只做了一个近似梯形区域的掩模:
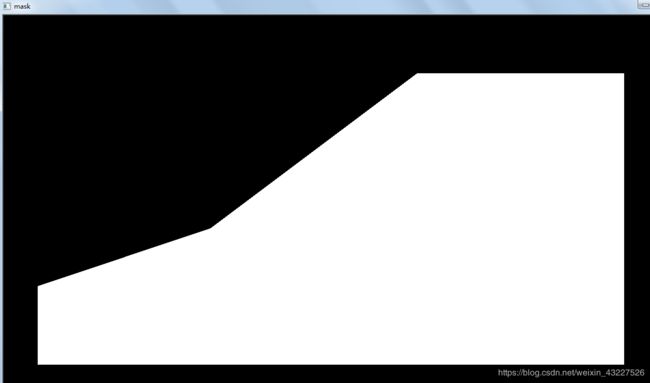
生成这个掩模的程序:
cv2.fillPoly函数用来填充凸多边形,只需给出凸多边形的顶点。
这里的vertices指的是用顶点坐标确定的待填充的区域,
此时的mask 把图区域内填充成255,其他区域是0,将mask于原图像进行“与”运算。
   def filter_region(self,image, vertices):
        """
        剔除掉不需要的地方
        """
        mask = np.zeros_like(image)
        if len(mask.shape) == 2:
            cv2.fillPoly(mask, vertices, 255)
            self.cv_show('mask', mask)
        return cv2.bitwise_and(image, mask)
还需要确定的是顶点坐标,也就是vertices中的内容。
梯形的顶点坐标我们怎么得到呢?
就是这几个点呐:

手动输入……我给你手动点赞,手动微笑,手动……
就是根据这张特定的图片,手动输入点的坐标,并把点的坐标存放到vertices中
    def select_region(self,image):
        """
                手动选择区域
        """
        rows, cols = image.shape[:2]
        pt_1 = [cols*0.05, rows*0.90]
        pt_2 = [cols*0.05, rows*0.70]
        pt_3 = [cols*0.30, rows*0.55]
        pt_4 = [cols*0.60, rows*0.15]
        pt_5 = [cols*0.90, rows*0.15]
        pt_6 = [cols*0.90, rows*0.90]
        vertices = np.array([[pt_1, pt_2, pt_3, pt_4, pt_5, pt_6]], dtype=np.int32)
        point_img = image.copy()
        point_img = cv2.cvtColor(point_img, cv2.COLOR_GRAY2RGB)
        for point in vertices[0]:
            cv2.circle(point_img, (point[0],point[1]), 10, (0,0,255), 4)
        self.cv_show('point_img',point_img)

        return self.filter_region(image, vertices)
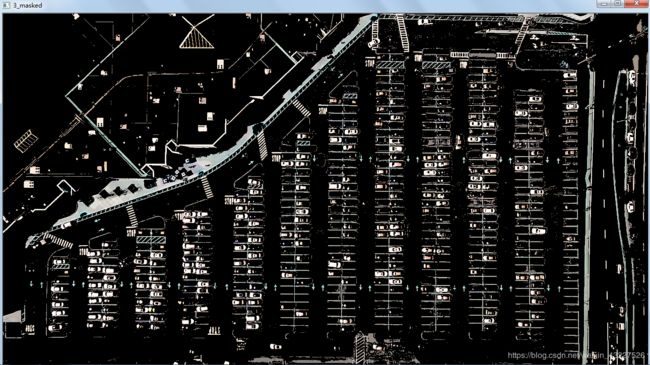
将mask和图像做“与”运算之前还需要对图像进行二值化。
white_mask = cv2.inRange(image, lower, upper)函数是对像素值低于lower和高于upper的点变为0(黑色), 在两只之间的像素点变为255(白色)。
np.zeros_like函数表示构造一个与原图像维度相同,所有元素初始化为0的矩阵。
    def select_rgb_white_yellow(self,image):
        # 过滤掉背景
        lower = np.uint8([120, 120, 120])
        upper = np.uint8([255, 255, 255])
        mask = np.zeros_like(image)
        print("len(mask.shape)", len(mask.shape))
        img_mask = cv2.bitwise_and(image, mask)
        white_mask = cv2.inRange(image, lower, upper)
        self.cv_show('2_white_mask',white_mask)
        masked = cv2.bitwise_and(image, image, mask=white_mask)
        self.cv_show('3_masked', masked)
        return masked
显示结果:
进行原图像和二值图像进行“与”操作结果如图:
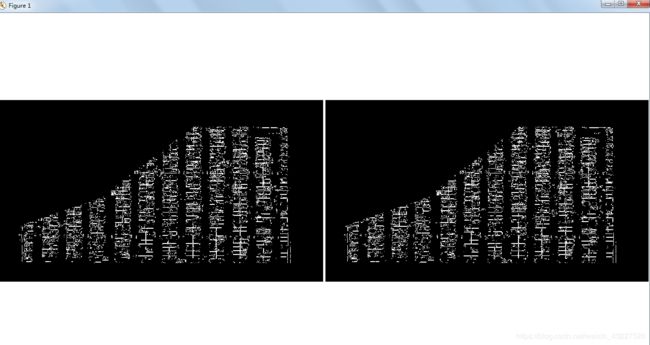
还有一步就是进行Canny边缘检测:
边缘检测的步骤
1.使用高斯滤波平滑图像,滤除噪声。
2.计算图像中每个像素点的强度和方向。
3.应用非极大值抑制,消除边缘检测带来的杂散响应。
4.应用双阈值(Double—Threshold)来检测潜在的和真实的边缘
5.通过抑制孤立的弱边缘点,最终完成边缘检测。
    def detect_edges(self,image, low_threshold=50, high_threshold=200):
        return cv2.Canny(image, low_threshold, high_threshold)
        cv2.imshow("image", image)
两个阈值值得是梯度:如果梯度大于200,那么判定为边缘;如果小于50,那么判定不是边缘;在两个值之间,又和确定的边缘相连,那么判定为是边缘。
图像进行Canny边缘检测之后再用掩模进行处理后结果如图所示:
(4)Hough直线检测
HoughLinesP函数是统计概率霍夫线变换函数
cv2.HoughLinesP函数的输入图像必须是边缘检测的结果
rho表示距离精度
theta表示角度精度
threshod表示检测为一条直线所需的最少交点。
minLineLength参数表示能组成一条直线的最少点的数量,点数量不足的直线将被抛弃。
maxLineGap参数表示能被认为在一条直线上的两个点的最大距离。
return cv2.HoughLinesP(image, rho=0.1, theta=np.pi/10, threshold=15, minLineLength=9, maxLineGap=4)
该函数的返回值是直线的起止点的坐标(x0,y0,x1,y1)
进一步对检测到的图片进行筛选:
    def draw_lines(self, image, lines, color=[255, 0, 0], thickness=2, make_copy=True):
        # 过滤霍夫变换检测到直线
        if make_copy:
            image = np.copy(image)
        cleaned = []
        for line in lines:
            for x1, y1, x2, y2 in line:
                if abs(y2-y1) <=1 and abs(x2-x1) >=25 and abs(x2-x1) <= 55:
                    cleaned.append((x1,y1,x2,y2))
                    cv2.line(image, (x1, y1), (x2, y2), color, thickness)
        print(" No lines detected: ", len(cleaned))
        return image
将检测到的直线中,起止位置纵坐标几乎不变(即水平的), 长度25 进一步对直线进行过滤: Step 2: 对直线进行排序; Step 3: 找到多个列,相当于每列是一排车。现在 Step 4: Step 5: 进行微调,画出矩形。 字典 遍历字典 用切片操作对图片进行裁剪并保存到指定路径,作为训练的数据集。 图片数据及将用于训练神经网络,将数据转化成4D tensor 将测试的结果以文本的形式显示在图片上 在条件允许的情况下,可以对视频进行实时的测试,检测停车场中的空车位。 至此,本项目的第一部分(图像处理部分完成),生成了用于模型训练的数据集 。 最后还是验证一下opencv库中彩色图像的三通道的排列是BGR而在plt库中是RGB 显示结果:
Step 1: 由于视频截取的图片中有大量的干扰信息,对过滤后的直线存放到clean中。itemgetter表示按照那个维度的信息进行排序。本实例中有限根据起始点的横坐标进行排序,如果相同则按照起始点的纵坐标进行排序。list1中是已经排好序的直线,但是现在的直线也是不准确的轮廓,我们将相邻的两条直线的起始点的横坐标进行比较。如果小于设定的distance值,那么把前一个直线存放到 clusters字典中,索引加1。那么clusters中存放的格式是clusters:{0:[(), (), ()], 1:[(), (), ()], 2:[(), (), ()]}……cleaned中存放的是用set函数去掉clusters中的重复元素的直线。对cleaned按照直线起始点的纵坐标进行排序,体现在车位上就是同一列车位。 avg_y1表示同一列中第一条直线起始点的纵坐标。avg_y2表示最后一条直线起始点的纵坐标。avg_x1表示同一列中起始点横坐标的平均值,avg_x2表示终止点的横坐标的平均值。这一步确定的是一列停车位的外接矩形的四个顶点。 def identify_blocks(self, image, lines, make_copy=True):
if make_copy:
new_image = np.copy(image)
cleaned = []
for line in lines:
for x1, y1, x2, y2 in line:
if abs(y2-y1) <=1 and abs(x2-x1) >=25 and abs(x2-x1) <= 55:
cleaned.append((x1,y1,x2,y2))
import operator
list1 = sorted(cleaned, key=operator.itemgetter(0, 1))
clusters = {}
dIndex = 0
clus_dist = 10
for i in range(len(list1) - 1):
distance = abs(list1[i+1][0] - list1[i][0])
if distance <= clus_dist:
if not dIndex in clusters.keys(): clusters[dIndex] = []
clusters[dIndex].append(list1[i])
clusters[dIndex].append(list1[i + 1])
else:
dIndex += 1
rects = {}
i = 0
for key in clusters:
all_list = clusters[key]
cleaned = list(set(all_list))
if len(cleaned) > 5:
cleaned = sorted(cleaned, key=lambda tup: tup[1])
# 分别取出同一列车位中第一条直线和最后一条直线的起始点的纵坐标
avg_y1 = cleaned[0][1]
avg_y2 = cleaned[-1][1]
avg_x1 = 0
avg_x2 = 0
# 对每一列车位的横坐标,起始点横坐标的平均值,截止点横坐标的平均值
for tup in cleaned:
avg_x1 += tup[0]
avg_x2 += tup[2]
avg_x1 = avg_x1/len(cleaned)
avg_x2 = avg_x2/len(cleaned)
# avg_x1,avg_x2表示取完平均值起止位置的横坐标
# rects中存储的是每一列车位,外接矩形的左上角和右下角的坐标
rects[i] = (avg_x1, avg_y1, avg_x2, avg_y2)
i += 1
# 计算一共有多少列
print("Num Parking Lanes: ", len(rects))
# Step 5: 把列矩形画出来
buff = 7
for key in rects:
# 微调,左边扩充7个像素点
tup_topLeft = (int(rects[key][0] - buff), int(rects[key][1]))
tup_botRight = (int(rects[key][2] + buff), int(rects[key][3]))
cv2.rectangle(new_image, tup_topLeft, tup_botRight, (0, 232, 255), 3)
return new_image, rects
(5)将每个车位与字典中的元素对应
adj_x1,adj_y1,adj_x2,adj_y2表示微调的量,
而tup中存放的是这12列停车位调节以后的矩形左上角和右下角的坐标。
画出每一列停车位中的每一条小的横线。而且本实例中只有第一列和最后一列只有一排停车位,而其他列中都有两排,即中间用一条竖线分割开。这条竖线就取中值啊(呵,数学题)。
然后计算整个停车场车位的数量,处理第一列和最后一列只有一排车位,其他列都有两排要乘以2。
将每一个停车位与字典spot_dict对应。 def draw_parking(self,image, rects, make_copy = True, color=[255, 0, 0], thickness=2, save = True):
if make_copy:
new_image = np.copy(image)
# gap表示每一列中竖直方向两个车位之间的距离大小
gap = 15.5
spot_dict = {} # 字典:一个车位对应一个位置
tot_spots = 0
# 微调fine-turning
adj_y1 = {0: 20, 1: -10, 2: 0, 3: -11, 4: 28, 5: 5, 6: -15, 7: -15, 8: -10, 9: -30, 10: 9, 11: -32}
adj_y2 = {0: 30, 1: 50, 2: 15, 3: 10, 4: -15, 5: 15, 6: 15, 7: -20, 8: 15, 9: 15, 10: 0, 11: 30}
adj_x1 = {0: -8, 1: -15, 2: -15, 3: -15, 4: -15, 5: -15, 6: -15, 7: -15, 8: -10, 9: -10, 10: -10, 11: 0}
adj_x2 = {0: 0, 1: 15, 2: 15, 3: 15, 4: 15, 5: 15, 6: 15, 7: 15, 8: 10, 9: 10, 10: 10, 11: 0}
for key in rects:
tup = rects[key]
x1 = int(tup[0] + adj_x1[key])
x2 = int(tup[2] + adj_x2[key])
y1 = int(tup[1] + adj_y1[key])
y2 = int(tup[3] + adj_y2[key])
# 画出矩形
cv2.rectangle(new_image, (x1, y1),(x2,y2),(0,255,0),2)
num_splits = int(abs(y2-y1)//gap)
print('num_splits', num_splits)
for i in range(0, num_splits+1):
y = int(y1 + i*gap)
# 画出每一列中的每一条小的横线
cv2.line(new_image, (x1, y), (x2, y), color, thickness)
if key > 0 and key < len(rects) -1 :
# 画竖线
x = int((x1 + x2)/2)
cv2.line(new_image, (x, y1), (x, y2), color, thickness)
# 计算数量
if key == 0 or key == (len(rects) -1):
tot_spots += num_splits +1
else:
tot_spots += 2*(num_splits +1)
# 字典对应好
if key == 0 or key == (len(rects) -1):
for i in range(0, num_splits+1):
cur_len = len(spot_dict)
y = int(y1 + i*gap)
spot_dict[(x1, y, x2, y+gap)] = cur_len +1
else:
for i in range(0, num_splits+1):
cur_len = len(spot_dict)
y = int(y1 + i*gap)
x = int((x1 + x2)/2)
spot_dict[(x1, y, x, y+gap)] = cur_len +1
spot_dict[(x, y, x2, y+gap)] = cur_len +2
# 字典中存储的是每一个车位中横线的起止坐标
print("total parking spaces: ", tot_spots, cur_len)
if save:
filename = 'with_parking.jpg'
cv2.imwrite(filename, new_image)
return new_image, spot_dict
画出每一个车位对应的矩形
spot_dict中的直线的定位点,每个车位对应的矩形 def assign_spots_map(self,image, spot_dict, make_copy = True, color=[255, 0, 0], thickness=2):
if make_copy:
new_image = np.copy(image)
for spot in spot_dict.keys():
(x1, y1, x2, y2) = spot
# 遍历spot_dict中的点的坐标,画出矩形
cv2.rectangle(new_image, (int(x1),int(y1)), (int(x2),int(y2)), color, thickness)
return new_image
    def save_images_for_cnn(self,image, spot_dict, folder_name ='cnn_data'):
        for spot in spot_dict.keys():
            (x1, y1, x2, y2) = spot
            (x1, y1, x2, y2) = (int(x1), int(y1), int(x2), int(y2))

            spot_img = image[y1:y2, x1:x2]
            spot_img = cv2.resize(spot_img, (0,0), fx=2.0, fy=2.0)
            spot_id = spot_dict[spot]

            filename = 'spot' + str(spot_id) +'.jpg'
            print(spot_img.shape, filename, (x1,x2,y1,y2))
            cv2.imwrite(os.path.join(folder_name, filename), spot_img)
(6)数据预处理
    def make_prediction(self, image,model,class_dictionary):
        # 预处理
        img = image/255.

        # 转换成4D tensor
        image = np.expand_dims(img, axis=0)

        # 用训练好的模型进行训练
        class_predicted = model.predict(image)
        inID = np.argmax(class_predicted[0])
        label = class_dictionary[inID]
        return label
    def predict_on_image(self,image, spot_dict , model,class_dictionary,make_copy=True, color = [0, 255, 0], alpha=0.5):
        if make_copy:
            new_image = np.copy(image)
            overlay = np.copy(image)
        self.cv_show('new_image',new_image)
        cnt_empty = 0
        all_spots = 0
        for spot in spot_dict.keys():
            all_spots += 1
            (x1, y1, x2, y2) = spot
            (x1, y1, x2, y2) = (int(x1), int(y1), int(x2), int(y2))
            spot_img = image[y1:y2, x1:x2]
            spot_img = cv2.resize(spot_img, (48, 48))

            label = self.make_prediction(spot_img,model,class_dictionary)
            if label == 'empty':
                cv2.rectangle(overlay, (int(x1),int(y1)), (int(x2),int(y2)), color, -1)
                cnt_empty += 1

        cv2.addWeighted(overlay, alpha, new_image, 1 - alpha, 0, new_image)

        cv2.putText(new_image, "Available: %d spots" %cnt_empty, (30, 95),
        cv2.FONT_HERSHEY_SIMPLEX,
        0.7, (255, 255, 255), 2)

        cv2.putText(new_image, "Total: %d spots" %all_spots, (30, 125),
        cv2.FONT_HERSHEY_SIMPLEX,
        0.7, (255, 255, 255), 2)
        save = False

        if save:
            filename = 'with_marking.jpg'
            cv2.imwrite(filename, new_image)
        self.cv_show('new_image',new_image)

        return new_image
    def predict_on_video(self,video_name,final_spot_dict, model,class_dictionary,ret=True):
        cap = cv2.VideoCapture(video_name)
        count = 0
        while ret:
            ret, image = cap.read()
            count += 1
            if count == 5:
                count = 0

                new_image = np.copy(image)
                overlay = np.copy(image)
                cnt_empty = 0
                all_spots = 0
                color = [0, 255, 0]
                alpha=0.5
                for spot in final_spot_dict.keys():
                    all_spots += 1
                    (x1, y1, x2, y2) = spot
                    (x1, y1, x2, y2) = (int(x1), int(y1), int(x2), int(y2))
                    spot_img = image[y1:y2, x1:x2]
                    spot_img = cv2.resize(spot_img, (48,48))

                    label = self.make_prediction(spot_img,model,class_dictionary)
                    if label == 'empty':
                        cv2.rectangle(overlay, (int(x1),int(y1)), (int(x2),int(y2)), color, -1)
                        cnt_empty += 1

                cv2.addWeighted(overlay, alpha, new_image, 1 - alpha, 0, new_image)

                cv2.putText(new_image, "Available: %d spots" %cnt_empty, (30, 95),
                cv2.FONT_HERSHEY_SIMPLEX,
                0.7, (255, 255, 255), 2)

                cv2.putText(new_image, "Total: %d spots" %all_spots, (30, 125),
                cv2.FONT_HERSHEY_SIMPLEX,
                0.7, (255, 255, 255), 2)
                cv2.imshow('frame', new_image)
                if cv2.waitKey(10) & 0xFF == ord('q'):
                    break

        cv2.destroyAllWindows()
        cap.release()
import cv2
img = cv2.imread("kkk.jpg")
b = img[:, :, 0]
g = img[:, :, 1]
r = img[:, :, 2]
back = cv2.merge([b, g, r])
back_tr = cv2.merge([r, g, b])
cv2.imshow("original", img)
cv2.imshow("b", b)
cv2.imshow("g", g)
cv2.imshow("r", r)
cv2.imshow("bgr", back)
cv2.imshow("rgb", back_tr)
cv2.waitKey(0)
cv2.destroyAllWindows()