眨眼又到了年底,心里开始长草,回想2016,没啥成就,便在这千万人都立志的时刻,重新倒腾一下实时流式处理.
So,以前搭建环境最让人头疼的就是搭建Storm集群,各种依赖,稍有不慎,版本就不兼容,所以,此次首先是从storm开始.
Zookeeper的搭建就略过了,随便百度一下Zookeeper,只要不是太古老的技术贴,都能照着葫芦画瓢.
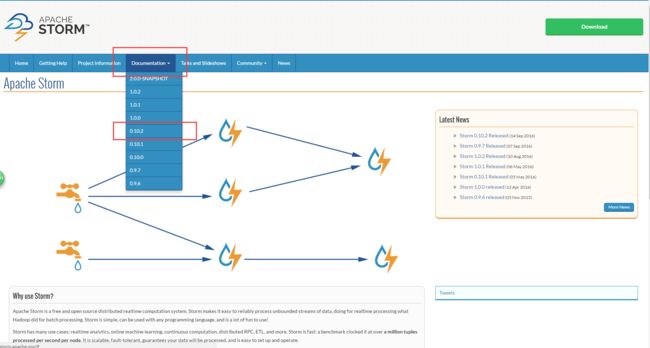
这次搭建Storm,留了个心眼,首先去官网看了下最新版本,看完之后,O(∩_∩)O哈哈~,心理美滋滋哎
storm官网
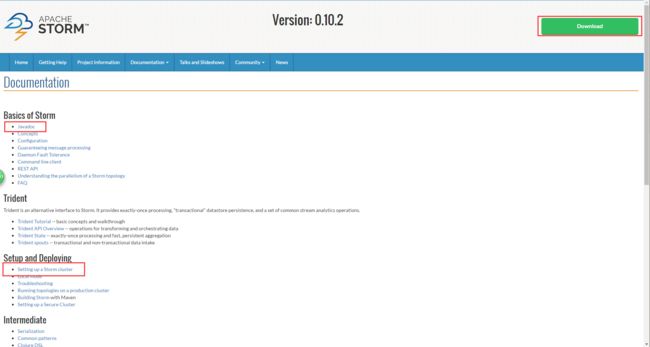
从此处查看storm的最新的稳定版本,本次小编选择的是Version: 0.10.2,迫不及待的点击后,进入下面的页面:
首先能看到的就是一个大大的download,再仔细找找还能找到javadoc以及Setup and Deploying.小伙伴,赶紧点击进去吧,Setup and Deploying.
再来看下面这张图
这可是一手鞋,太棒了,终于不用忍受二手鞋的各种不合脚.
下面原谅小鞭贴英文原版的安装步骤:
Setting up a Storm Cluster
This page outlines the steps for getting a Storm cluster up and running. If you're on AWS, you should check out the storm-deploy project. storm-deploy completely automates the provisioning, configuration, and installation of Storm clusters on EC2. It also sets up Ganglia for you so you can monitor CPU, disk, and network usage.
If you run into difficulties with your Storm cluster, first check for a solution is in the Troubleshooting page. Otherwise, email the mailing list.
Here's a summary of the steps for setting up a Storm cluster:
Set up a Zookeeper cluster Install dependencies on Nimbus and worker machines Download and extract a Storm release to Nimbus and worker machines Fill in mandatory configurations into storm.yaml Launch daemons under supervision using "storm" script and a supervisor of your choice Set up a Zookeeper cluster Storm uses Zookeeper for coordinating the cluster. Zookeeper is not used for message passing, so the load Storm places on Zookeeper is quite low. Single node Zookeeper clusters should be sufficient for most cases, but if you want failover or are deploying large Storm clusters you may want larger Zookeeper clusters. Instructions for deploying Zookeeper are here.
A few notes about Zookeeper deployment:
It's critical that you run Zookeeper under supervision, since Zookeeper is fail-fast and will exit the process if it encounters any error case. See here for more details. It's critical that you set up a cron to compact Zookeeper's data and transaction logs. The Zookeeper daemon does not do this on its own, and if you don't set up a cron, Zookeeper will quickly run out of disk space. See here for more details. Install dependencies on Nimbus and worker machines _**Next you need to install Storm's dependencies on Nimbus and the worker machines. These are:
Java 7 Python 2.6.6**_ These are the versions of the dependencies that have been tested with Storm. Storm may or may not work with different versions of Java and/or Python.
Download and extract a Storm release to Nimbus and worker machines Next, download a Storm release and extract the zip file somewhere on Nimbus and each of the worker machines. The Storm releases can be downloaded from here.
Fill in mandatory configurations into storm.yaml The Storm release contains a file at conf/storm.yaml that configures the Storm daemons. You can see the default configuration values here. storm.yaml overrides anything in defaults.yaml. There's a few configurations that are mandatory to get a working cluster:
- storm.zookeeper.servers: This is a list of the hosts in the Zookeeper cluster for your Storm cluster. It should look something like:
storm.zookeeper.servers:
- "111.222.333.444"
- "555.666.777.888" If the port that your Zookeeper cluster uses is different than the default, you should set storm.zookeeper.port as well.
- storm.local.dir: The Nimbus and Supervisor daemons require a directory on the local disk to store small amounts of state (like jars, confs, and things like that). You should create that directory on each machine, give it proper permissions, and then fill in the directory location using this config. For example:
storm.local.dir: "/mnt/storm" If you run storm on windows,it could be: yaml storm.local.dir: "C:\storm-local" If you use a relative path,it will be relative to where you installed storm(STORM_HOME). You can leave it empty with default value $STORM_HOME/storm-local
- nimbus.seeds: The worker nodes need to know which machines are the candidate of master in order to download topology jars and confs. For example:
nimbus.seeds: ["111.222.333.44"] You're encouraged to fill out the value to list of machine's FQDN. If you want to set up Nimbus H/A, you have to address all machines' FQDN which run nimbus. You may want to leave it to default value when you just want to set up 'pseudo-distributed' cluster, but you're still encouraged to fill out FQDN.
- supervisor.slots.ports: For each worker machine, you configure how many workers run on that machine with this config. Each worker uses a single port for receiving messages, and this setting defines which ports are open for use. If you define five ports here, then Storm will allocate up to five workers to run on this machine. If you define three ports, Storm will only run up to three. By default, this setting is configured to run 4 workers on the ports 6700, 6701, 6702, and 6703. For example:
supervisor.slots.ports: - 6700 - 6701 - 6702 - 6703 Monitoring Health of Supervisors Storm provides a mechanism by which administrators can configure the supervisor to run administrator supplied scripts periodically to determine if a node is healthy or not. Administrators can have the supervisor determine if the node is in a healthy state by performing any checks of their choice in scripts located in storm.health.check.dir. If a script detects the node to be in an unhealthy state, it must print a line to standard output beginning with the string ERROR. The supervisor will periodically run the scripts in the health check dir and check the output. If the script’s output contains the string ERROR, as described above, the supervisor will shut down any workers and exit.
If the supervisor is running with supervision "/bin/storm node-health-check" can be called to determine if the supervisor should be launched or if the node is unhealthy.
The health check directory location can be configured with:
storm.health.check.dir: "healthchecks"
The scripts must have execute permissions. The time to allow any given healthcheck script to run before it is marked failed due to timeout can be configured with:
storm.health.check.timeout.ms: 5000 Configure external libraries and environmental variables (optional) If you need support from external libraries or custom plugins, you can place such jars into the extlib/ and extlib-daemon/ directories. Note that the extlib-daemon/ directory stores jars used only by daemons (Nimbus, Supervisor, DRPC, UI, Logviewer), e.g., HDFS and customized scheduling libraries. Accordingly, two environmental variables STORM_EXT_CLASSPATH and STORM_EXT_CLASSPATH_DAEMON can be configured by users for including the external classpath and daemon-only external classpath.
Launch daemons under supervision using "storm" script and a supervisor of your choice The last step is to launch all the Storm daemons. It is critical that you run each of these daemons under supervision. Storm is a fail-fast system which means the processes will halt whenever an unexpected error is encountered. Storm is designed so that it can safely halt at any point and recover correctly when the process is restarted. This is why Storm keeps no state in-process -- if Nimbus or the Supervisors restart, the running topologies are unaffected. Here's how to run the Storm daemons:
Nimbus: Run the command "bin/storm nimbus" under supervision on the master machine. Supervisor: Run the command "bin/storm supervisor" under supervision on each worker machine. The supervisor daemon is responsible for starting and stopping worker processes on that machine. UI: Run the Storm UI (a site you can access from the browser that gives diagnostics on the cluster and topologies) by running the command "bin/storm ui" under supervision. The UI can be accessed by navigating your web browser to http://{ui host}:8080. As you can see, running the daemons is very straightforward. The daemons will log to the logs/ directory in wherever you extracted the Storm release.
看到小鞭表粗的的位置了吗,神马?只需要安装Java和Python,太棒了......
于是小鞭怀着无比激动的心情,下载了storm,解压,这些都略过.
下面开始说说我的集群分布:
小鞭手头有若干台测试机器,咳咳咳,当然是公司的...准备使用三台机器来搭建storm集群,ip地址如下:
192.168.2.141 node2
192.168.2.142 node3
192.168.2.143 node4
接下来,去解压目录中去找到配置文件apache-storm-1.0.2/conf/storm.yaml
小鞭直接贴我的配置了, 详细配置说明,诸君就自行百度啦
# Licensed to the Apache Software Foundation (ASF) under one
# or more contributor license agreements.  See the NOTICE file
# distributed with this work for additional information
# regarding copyright ownership.  The ASF licenses this file
# to you under the Apache License, Version 2.0 (the
# "License"); you may not use this file except in compliance
# with the License.  You may obtain a copy of the License at
#
# http://www.apache.org/licenses/LICENSE-2.0
#
# Unless required by applicable law or agreed to in writing, software
# distributed under the License is distributed on an "AS IS" BASIS,
# WITHOUT WARRANTIES OR CONDITIONS OF ANY KIND, either express or implied.
# See the License for the specific language governing permissions and
# limitations under the License.

########### These MUST be filled in for a storm configuration
 storm.zookeeper.servers:
     - "node1"
     - "node2"
     - "node3"


 storm.local.dir: "/home/hadoop/app/storm/local-dir"
#
 nimbus.seeds: ["node1"]
#
#
# ##### These may optionally be filled in:
#
## List of custom serializations
# topology.kryo.register:
#     - org.mycompany.MyType
#     - org.mycompany.MyType2: org.mycompany.MyType2Serializer
#
## List of custom kryo decorators
# topology.kryo.decorators:
#     - org.mycompany.MyDecorator
#
## Locations of the drpc servers
 drpc.servers:
     - "node1"
#     - "server2"
# drpc.port:7777

## Metrics Consumers
# topology.metrics.consumer.register:
#   - class: "org.apache.storm.metric.LoggingMetricsConsumer"
#     parallelism.hint: 1
#   - class: "org.mycompany.MyMetricsConsumer"
#     parallelism.hint: 1
#     argument:
#       - endpoint: "metrics-collector.mycompany.org"

#ui.port:58080
接下来,就是要启动storm集群
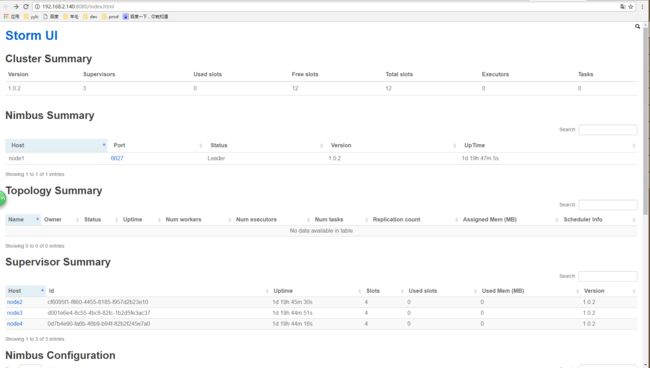
以下是启动Storm各个后台进程的方式: Nimbus: 在Storm主控节点上运行”bin/storm nimbus >/dev/null 2>&1 &”启动Nimbus后台程序,并放到后台执行; Supervisor: 在Storm各个工作节点上运行”bin/storm supervisor >/dev/null 2>&1 &”启动Supervisor后台程序,并放到后台执行; UI: 在Storm主控节点上运行”bin/storm ui >/dev/null 2>&1 &”启动UI后台程序,并放到后台执行,启动后可以通过http://{nimbus host}:8080观察集群的worker资源使用情况、Topologies的运行状态等信息。
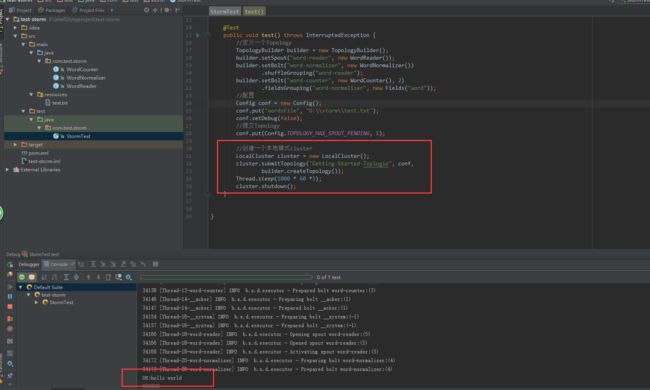
看到这张图,是不是很激动,easy,咱们再试试javaApi
如果看到这张图,你就信以为真了,那就错了,哈哈,这可是本地的cluster,是开发storm应用的时候本地测试使用的.你需要把自己的应用打包,丢到集群上去执行,当然,你也可以通过IDE直接部署到集群上.
反正我搭建的集群是可以用的了,就这样啦,改天继续flume和kafka......
/猫小鞭*******/


