SpringMVC整合Highcharts(基本饼图,条形图,柱状图)
步骤
1、引入highcharts
<script type="text/javascript" src="${context.getContextPath()}/js/highcharts/highcharts.js">script>
<script type="text/javascript" src="${context.getContextPath()}/js/highcharts/highcharts-more.js">script>
<script type="text/javascript" src="${context.getContextPath()}/js/highcharts/highcharts-3d.js">script>
2、 添加条形图标签
<div id="container">div>3、渲染条形图
var chart = Highcharts.chart('container',{
    title: {
        text: 'Solar Employment Growth by Sector, 2010-2016'
    },
    credits: { enabled: false},
    exporting: { enabled: false },
    subtitle: {
        text: 'Source: thesolarfoundation.com'
    },

    yAxis: {
        title: {
            text: 'Number of Employees'
        }
    },
    legend: {
        layout: 'vertical',
        align: 'right',
        verticalAlign: 'middle'
    },

    plotOptions: {
        series: {
            label: {
                connectorAllowed: false
            },
            pointStart: 2010
        }
    },

    series: [{
        name: 'Installation'
    }, {
        name: 'Manufacturing'

    }, {
        name: 'Sales & Distribution'

    }, {
        name: 'Project Development'
    }],

    responsive: {
        rules: [{
            condition: {
                maxWidth: 500
            },
            chartOptions: {
                legend: {
                    layout: 'horizontal',
                    align: 'center',
                    verticalAlign: 'bottom'
                }
            }
        }]
    }

});
4、往插入数据
$.ajax({
    type:"GET",
    url:'${rc.getContextPath()}/chart/columeValue',//提供数据的Servlet
    success:function(data){
        //迭代,把异步获取的数据放到数组中
        $.each(data,function(i,d){
            chart.series[i].setData(d.data);
        });
    },
    error:function(e){
        alert(e);
    }
});
完整代码
1、前端
<html>
<head>
<meta http-equiv="Content-Type" content="text/html; charset=utf-8">
<title>Highcharts Exampletitle>
<style type="text/css">
#container {
min-width: 310px;
max-width: 800px;
height: 400px;
margin: 0 auto
}
.main {float:left;border:1px width:100%; }
.left{float:left;border:1px width:40%; }
.right {float:left;border:1px width:40%; }
style>
head>
<body>
<table>
<tr>
<td>
<div id="container">div>
td>
<td>
<div id="container2" style="min-width: 310px; height: 400px; margin: 0 auto">div>
td>
tr>
<tr>
<td>
<div id="container3" >div>
td>
<td>
<div id="container4" >div>
td>
tr>
table>
<script type="text/javascript" src="${context.getContextPath()}/js/highcharts/highcharts.js">script>
<script type="text/javascript" src="${context.getContextPath()}/js/highcharts/highcharts-more.js">script>
<script type="text/javascript" src="${context.getContextPath()}/js/highcharts/highcharts-3d.js">script>
<script type="text/javascript" src="${context.getContextPath()}/js/jquery-1.7.1.min.js">script>
<script type="text/javascript" src="${context.getContextPath()}/js/jquery.js">script>
<script type="text/javascript">
//条形图
var chart = Highcharts.chart('container',{
title: {
text: 'Solar Employment Growth by Sector, 2010-2016'
},
credits: { enabled: false},
exporting: { enabled: false },
subtitle: {
text: 'Source: thesolarfoundation.com'
},
yAxis: {
title: {
text: 'Number of Employees'
}
},
legend: {
layout: 'vertical',
align: 'right',
verticalAlign: 'middle'
},
plotOptions: {
series: {
label: {
connectorAllowed: false
},
pointStart: 2010
}
},
series: [{
name: 'Installation'
}, {
name: 'Manufacturing'
}, {
name: 'Sales & Distribution'
}, {
name: 'Project Development'
}],
responsive: {
rules: [{
condition: {
maxWidth: 500
},
chartOptions: {
legend: {
layout: 'horizontal',
align: 'center',
verticalAlign: 'bottom'
}
}
}]
}
});
//柱状图
var chart2 = Highcharts.chart('container2', {
chart: {
type: 'column'
},
credits: { enabled: false},
exporting: { enabled: false },
title: {
text: '每月降雨量'
},
subtitle: {
text: 'Source: WorldClimate.com'
},
xAxis: {
categories: [
'Jan',
'Feb',
'Mar',
'Apr',
'May',
'Jun',
'Jul',
'Aug',
'Sep',
'Oct',
'Nov',
'Dec'
],
crosshair: true
},
yAxis: {
min: 0,
title: {
text: 'Rainfall (mm)'
}
},
tooltip: {
headerFormat: '{point.key}',
pointFormat: '{series.name}: ' +
'{point.y:.1f} mm
',
shared: true,
useHTML: true
},
plotOptions: {
column: {
pointPadding: 0.2,
borderWidth: 0
}
},
series: [{
name: '四川'
},{
name: '广西'
},{
name: '山东'
},{
name: '浙江'
}]
});
//饼图
var chart3 = Highcharts.chart('container3',{
chart: {
plotBackgroundColor: null,
plotBorderWidth: null,
plotShadow: false,
type: 'pie'
},
credits: { enabled: false},
exporting: { enabled: false },
title: {
text: '浏览器份额'
},
tooltip: {
pointFormat: '{series.name}: {point.percentage:.1f}%'
},
plotOptions: {
pie: {
allowPointSelect: true,
cursor: 'pointer',
dataLabels: {
enabled: true,
format: '{point.name}: {point.percentage:.1f} %',
style: {
color: (Highcharts.theme && Highcharts.theme.contrastTextColor) || 'black'
}
}
}
},
series: [{
name: 'Brands',
colorByPoint: true
}]
});
//饼图
var chart4 = Highcharts.chart('container4',{
chart: {
plotBackgroundColor: null,
plotBorderWidth: null,
plotShadow: false,
type: 'pie'
},
credits: { enabled: false},
exporting: { enabled: false },
title: {
text: '浏览器份额'
},
tooltip: {
pointFormat: '{series.name}: {point.percentage:.1f}%'
},
plotOptions: {
pie: {
allowPointSelect: true,
cursor: 'pointer',
dataLabels: {
enabled: true,
format: '{point.name}: {point.percentage:.1f} %',
style: {
color: (Highcharts.theme && Highcharts.theme.contrastTextColor) || 'black'
}
}
}
},
series: [{
name: 'Brands',
colorByPoint: true
}]
});
$(document).ready(function () {
$.ajax({
type:"GET",
url:'${rc.getContextPath()}/demo/pieValue',//提供数据的Servlet
success:function(data){
//定义一个数组
var browsers = [];
//迭代,把异步获取的数据放到数组中
$.each(data,function(i,d){
browsers.push([d.name,d.value]);
});
//var browsers = [];
//browsers.push(['AAA',1]);
//browsers.push(['业务办理',422]);
//browsers.push(['业务咨询',587]);
//browsers.push(['其他',115]);
//browsers.push(['投诉与建议',350]);
//browsers.push(['放款信息',54]);
chart3.series[0].setData(browsers);
},
error:function(e){
alert(e);
}
});
$.ajax({
type:"GET",
url:'${rc.getContextPath()}/demo/pieValue',//提供数据的Servlet
success:function(data){
//定义一个数组
var browsers = [];
//迭代,把异步获取的数据放到数组中
$.each(data,function(i,d){
browsers.push(['AAA',555]);
});
//设置数据
chart4.series[0].setData(browsers);
},
error:function(e){
alert(e);
}
});
$.ajax({
type:"GET",
url:'${rc.getContextPath()}/chart/columeValue',//提供数据的Servlet
success:function(data){
//迭代,把异步获取的数据放到数组中
$.each(data,function(i,d){
chart2.series[i].setData(d.data);
});
},
error:function(e){
alert(e);
}
});
$.ajax({
type:"GET",
url:'${rc.getContextPath()}/chart/columeValue',//提供数据的Servlet
success:function(data){
//迭代,把异步获取的数据放到数组中
$.each(data,function(i,d){
chart.series[i].setData(d.data);
});
},
error:function(e){
alert(e);
}
});
});
script>
body>
html>2、后端
/**
 * Project: report
 * Title:
 * Description:
 *
 * @author liguodong
 * @version 1.0.0
 * @date 2017/12/6 17:22 星期三
 */

@Controller
@RequestMapping("/chart")
public class ChartController {

    private static final Logger LOGGER = LoggerFactory.getLogger(ChartController.class);


    /**
     * /chart/pieValue
     * @return
     */
    @RequestMapping(value = "/pieValue", method = RequestMethod.GET)
    @ResponseBody
    public List pieValue(){
        List resultList = new ArrayList<>();
        resultList.add(new PieVO("Chrome",18.55D));
        resultList.add(new PieVO("Firefoc",19.99D));
        resultList.add(new PieVO("IE",54.13D));
        resultList.add(new PieVO("Oher",0.49D));
        resultList.add(new PieVO("Oprea",1.63D));
        resultList.add(new PieVO("Safari",5.21D));
        return resultList;
    }


    /**
     * /chart/pieValue
     * @return
     */
    @RequestMapping(value = "/columeValue", method = RequestMethod.GET)
    @ResponseBody
    public List columeValue(){
        List doubleList = new ArrayList<>(Arrays.asList(1D,2D,3D,4D,5D,6D,7D,8D,9D,10D,11D,12D));
        List resultList = new ArrayList<>();
        resultList.add(new ColumnVO("四川",doubleList.stream().map(x->x+1).collect(Collectors.toList())));
        resultList.add(new ColumnVO("广西",doubleList.stream().map(x->x+5).collect(Collectors.toList())));
        resultList.add(new ColumnVO("山东",doubleList.stream().map(x->x+4).collect(Collectors.toList())));
        resultList.add(new ColumnVO("浙江",doubleList.stream().map(x->x+7).collect(Collectors.toList())));
        return resultList;
    }

}
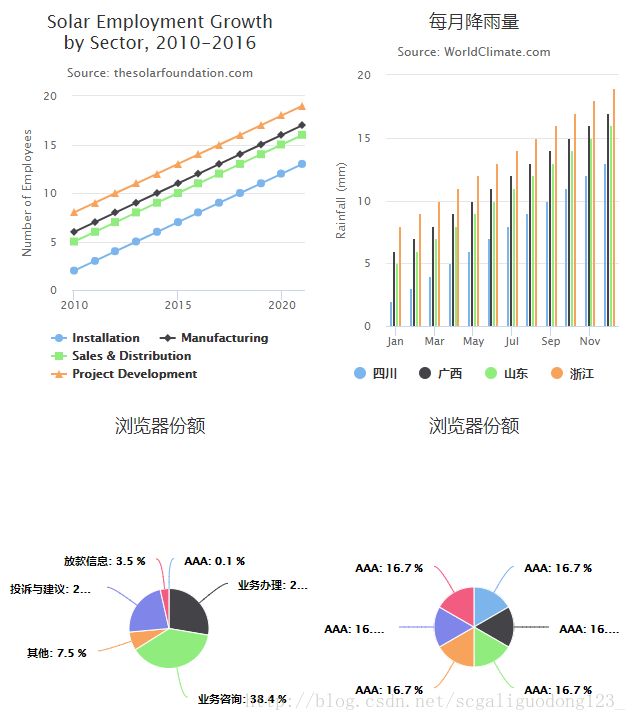
3、效果图
参考
Highcharts中更新series的5种方法
Highcharts API