echarts中部分功能实现
1.vue中echarts渲染的速度很慢,建议在加载的过程中加入loading加载。
2.给echarts添加标记线(如平均线)、标记点(如最大值、最小值)
series: [
          {
            data: [0, 5, 120, 932, 901, 934, 1290, 1330, 1320],
            type: "line",
            //标记点
            markPoint: {
              data: [
                { type: "max", name: "最大值" },
                { type: "min", name: "最小值" }
              ]
            },
            //平均线
            markLine: {
              data: [
                {
                  type: "average",
                  name: "平均值",
                  lineStyle: {
                    height: 2
                  }
                }
              ]
            }
          }
        ],
效果如下:
3.echarts图形月四周的距离:
series:[],
grid: {
   x: 50,
   y: 35,
   x2: 100,
   y2: 30
 }
其中,x(和左边的距离)、x2(和右边的距离)、y(和头部的距离)、y2(和底部的距离)
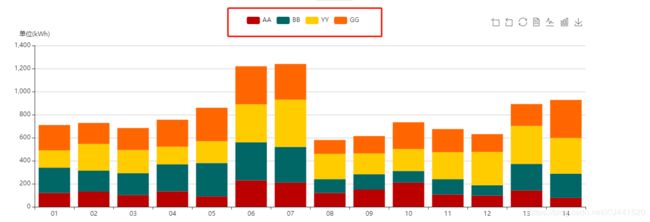
4.legend 关于图例文字说明
 legend: {
   data: ["AA", "BB", "YY", "GG"]
 },
如果我不想用固定的icon,或者字体颜色,如何自定义自己的legend呢?
legend: {
        textStyle: {
            //文字的颜色
            color: '#0f0'

        },
        //图标形状
        icon:'triangle',
        //icon的宽度
        itemWidth:10,
        //icon的高度
        itemHeight:10,

    }
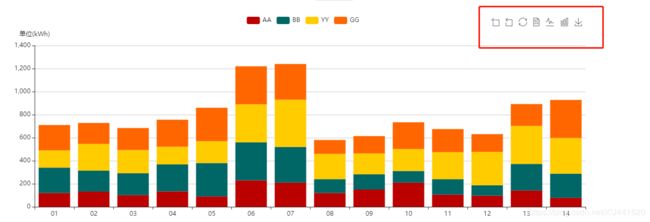
5.关于工具toolbox
toolbox: {
          feature: {
            dataZoom: {
              yAxisIndex: "none"
            },
            restore: {},
            dataView: { show: true, readOnly: false },
            magicType: { show: true, type: ["line", "bar"] },
            restore: { show: true },
            mark: { show: true },
            saveAsImage: { show: true }
          },
          //距离图形左侧
          left: "80%"
},
6.关于折线图和柱状图多个不同的类型,在series并列写入几个:
 series: [
          {
            name: "AA",
            type: "bar",
            stack: "广告",
            data: [
              120,
              132,
              101,
              134,
              90,
              230,
              210,
              120,
              150,
              210,
              106,
              97,
              142,
              78
            ]
          },
          {
            name: "BB",
            type: "bar",
            stack: "电影",
            data: [
              220,
              182,
              191,
              234,
              290,
              330,
              310,
              120,
              132,
              101,
              134,
              90,
              230,
              210
            ]
          }
       ]
7.设置不同颜色:
 myChart1.setOption({
    color: ["#BB0000", "#006666", "#FFCC00", "#FF6600"],
});
总结:
- 有需要的去官方查,Echarts 实例 、Echarts 文档
- 以官方的为准,个人的仅做参考!


