quantile函数r语言_R中的Quantile()函数-简要指南
quantile函数r语言
You can generate the sample quantiles using the quantile() function in R.
您可以使用R中的Quantile()函数生成样本分位数。
Hello people, today we will be looking at how to find the quantiles of the values using the quantile() function.
大家好,今天我们将研究如何使用Quantile()函数查找值的分位数。
Quantile: In laymen terms, a quantile is nothing but a sample that is divided into equal groups or sizes. Due to this nature, the quantiles are also called as Fractiles. In the quantiles, the 25th percentile is called as lower quartile, 50th percentile is called as Median and the 75th Percentile is called as the upper quartile.
分位数:用外行术语来说,分位数不过是将样本分为相等的组或大小。 由于这种性质,分位数也称为分形。 在分位数中,第25个百分位数称为下四分位数,第50个百分位数称为中位数,第75个百分位数称为较高四分位数。
In the below sections, let’s see how this quantile() function works in R.
在以下各节中,让我们看一下Quantile()函数在R中的工作方式。
Quantile()函数语法 (Quantile() function syntax)
The syntax of the Quantile() function in R is,
R中的Quantile()函数的语法为:
quantile(x, probs = , na.rm = FALSE)
Where,
哪里,
- X = the input vector or the values X =输入向量或值
- Probs = probabilities of values between 0 and 1. Probs = 0和1之间的值的概率。
- na.rm = removes the NA values. na.rm =删除NA值。
R中Quantile()函数的简单实现 (A Simple Implementation of quantile() function in R)
Well, hope you are good with the definition and explanations about quantile function. Now, let’s see how quantile function works in R with the help of a simple example which returns the quantiles for the input data.
好吧,希望您对分位数功能的定义和解释感到满意。 现在,借助一个简单的示例(返回输入数据的分位数),让我们看看分位数功能如何在R中工作。
#creates a vector having some values and the quantile function will return the percentiles for the data.

df<-c(12,3,4,56,78,18,46,78,100)
quantile(df)
Output:
输出:
0%   25%   50%   75%   100%
3    12    46    78    100
In the above sample, you can observe that the quantile function first arranges the input values in the ascending order and then returns the required percentiles of the values.
在上面的示例中,您可以观察到分位数功能首先按升序排列输入值,然后返回所需的值的百分位。
Note: The quantile function divides the data into equal halves, in which the median acts as middle and over that the remaining lower part is lower quartile and upper part is upper quartile.
注意:分位数功能将数据分为相等的两半,其中中位数为中间,其余部分的下半部分为下四分位数,而上半部分为上四分位数。
处理缺失值–'NaN' (Handle the missing values – ‘NaN’)
NaN’s are everywhere. In this data-driven digital world, you may encounter these NaN’s more frequently, which are often called as the missing values. If your data by any means has these missing values, you can end up with getting the NaN’s in the output or the errors in the output.
NaN无处不在。 在这个数据驱动的数字世界中,您可能会更频繁地遇到这些NaN,这通常被称为缺失值。 如果您的数据无论如何都具有这些缺失的值,您最终可能会在输出中获得NaN或在输出中获得错误。
So, in order to handle these missing values, we are going to use na.rm function. This function will remove the NA values from our data and returns the true values.
因此,为了处理这些缺失的值,我们将使用na.rm 功能。 此函数将从我们的数据中删除NA值并返回真实值。
Let’s see how this works.
让我们看看它是如何工作的。
#creates a vector having values along with NaN's

df<-c(12,3,4,56,78,18,NA,46,78,100,NA)
quantile(df)
Output:
输出:
Error in quantile.default(df) :
missing values and NaN's not allowed if 'na.rm' is FALSE
Oh, we got an error. If your guess is regarding the NA values, you are absolutely smart. If NA values are present in our data, the majority of the functions will end up in returning the NA values itself or the error message as mentioned above.
哦,我们出错了。 如果您的猜测与NA值有关,那么您绝对聪明。 如果我们的数据中存在NA值,则大多数函数最终将返回NA值本身或如上所述的错误消息。
Well, let’s remove these missing values using the na.rm function.
好吧,让我们使用na.rm函数删除这些缺失的值。
#creates a vector having values along with NaN's

df<-c(12,3,4,56,78,18,NA,46,78,100,NA)

#removes the NA values and returns the percentiles
quantile(df,na.rm = TRUE)
Output:
输出:
0%  25%  50%  75%  100%
3   12    46   78   100
In the above sample, you can see the na.rm function and its impact on the output. The function will remove the NA’s to avoid the false output.
在上面的示例中,您可以看到na.rm函数及其对输出的影响。 该函数将删除NA,以避免错误的输出。
分位数中的“概率”参数 (The ‘Probs’ argument in the quantile)
As you can see the probs argument in the syntax, which is showcased in the very first section of the article, you may wonder what does it mean and how it works?. Well, the probs argument is passed to the quantile function to get the specific or the custom percentiles.
正如您在文章的第一部分中看到的语法中的probs参数一样,您可能想知道它的含义以及它的工作原理? 好吧,将probs参数传递给分位数函数以获取特定或自定义百分位数。
Seems to be complicated? Dont worry, I will break it down to simple terms.
似乎很复杂? 不用担心,我将其分解为简单的术语。
Well, whenever you use the function quantile, it returns the standard percentiles like 25,50 and 75 percentiles. But what if you want 47th percentile or maybe 88th percentile?
好吧,无论何时使用函数分位数,它都会返回标准百分位数,例如25,50和75百分位数。 但是,如果您想要47%或88%的百分比呢?
There comes the argument ‘probs’, in which you can specify the required percentiles to get those.
参数“ probs”出现了,您可以在其中指定所需的百分位数以获取这些百分数。
Before going to the example, you should know few things about the probs argment.
在进行示例之前,您应该不了解有关概率的知识。
Probs: The probs or the probabilities argument should lie between 0 and 1.
概率:概率或概率参数应介于0和1之间。
Here is a sample which illustrates the above statement.
这是说明上述陈述的样本。
#creates the vector of values

df<-c(12,3,4,56,78,18,NA,46,78,100,NA)

#returns the quantile of 22 and 77 th percentiles.
quantile(df,na.rm = T,probs = c(22,77))
Output:
输出:
Error in quantile.default(df, na.rm = T, probs = c(22, 77)) :
  'probs' outside [0,1]
Oh, it’s an error!
哦,这是一个错误!
Did you get the idea, what happened?
您知道了吗,发生了什么事?
Well, here comes the Probs statement. Even though we mentioned the right values in the probs argument, it violates the 0-1 condition. The probs argument should include the values which should lie in between 0 and 1.
好吧,这是Probs声明。 即使我们在probs参数中提到了正确的值,也违反了0-1条件。 probs参数应包含介于0和1之间的值。
So, we have to convert the probs 22 and 77 to 0.22 and 0.77. Now the input values is in between 0 and 1 right? I hope this makes sense.
因此,我们必须将概率22和77转换为0.22和0.77。 现在输入值在0到1之间吧? 我希望这是有道理的。
#creates a vector of values
df<-c(12,3,4,56,78,18,NA,46,78,100,NA)

#returns the 22 and 77th percentiles of the input values
quantile(df,na.rm = T,probs = c(0.22,0.77))
Output:
输出:
 22%       77%
10.08     78.00
“取消命名”功能及其用途 (The ‘Unname’ function and its use)
Suppose you want your code to only return the percentiles and avoid the cut points. In these situations, you can make use of the ‘unname’ function.
假设您希望代码仅返回百分位数,并避免出现切点。 在这种情况下,您可以使用“取消命名”功能。
The ‘unname’ function will remove the headings or the cut points ( 0%,25% , 50%, 75% , 100 %) and returns only the percentiles.
“取消命名”功能将删除标题或切点(0%,25%,50%,75%,100%),仅返回百分位数。
Let’s see how it works!
让我们看看它是如何工作的!
#creates a vector of values
df<-c(12,3,4,56,78,18,NA,46,78,100,NA)
quantile(df,na.rm = T,probs = c(0.22,0.77))

#avoids the cut-points and returns only the percentiles.
unname(quantile(df,na.rm = T,probs = c(0.22,0.77)))
Output:
输出:
10.08 78.00
Now, you can observe that the cut-points are disabled or removed by the unname function and returns only the percentiles.
现在,您可以观察到切点已被unname函数禁用或删除,并且仅返回百分位数。
“回合”功能及其用途 (The ’round’ function and its use)
We have discussed the round function in R in detail in the past article. Now, we are going to use the round function to round off the values.
过去的文章中,我们已经详细讨论了R中的round函数 。 现在,我们将使用round函数舍入值。
Let’s see how it works!
让我们看看它是如何工作的!
#creates a vector of values
df<-c(12,3,4,56,78,18,NA,46,78,100,NA)
quantile(df,na.rm = T,probs = c(0.22,0.77))

#returns the round off values
unname(round(quantile(df,na.rm = T,probs = c(0.22,0.77))))
Output:
输出:
10 78
As you can see that our output values are rounded off to zero decimal points.
如您所见,我们的输出值四舍五入到零小数点。
获取数据集中多个组/列的分位数 (Get the quantiles for the multiple groups/columns in a data set)
Till now, we have discussed the quantile function, its uses and applications as well as its arguments and how to use them properly.
到目前为止,我们已经讨论了分位数功能,其用途和应用以及其参数以及如何正确使用它们。
In this section, we are going to get the quantiles for the multiple columns in a data set. Sounds interesting? follow me!
在本节中,我们将获取数据集中多个列的分位数。 听起来不错? 跟着我!
I am going to use the ‘mtcars’ data set for this purpose and also using the ‘dplyr’ library for this.
我将为此目的使用“ mtcars”数据集,并为此使用“ dplyr”库。
#reads the data
data("mtcars")
#returns the top few rows of the data
head(mtcars)

#install required paclages
install.packages('dplyr')
library(dplyr)

#using tapply, we can apply the function to multiple groups
do.call("rbind",tapply(mtcars$mpg, mtcars$gear, quantile))
Output:
输出:
     0%     25%    50%     75%    100%
3   10.4   14.5   15.5   18.400   21.5
4   17.8   21.0   22.8   28.075   33.9
5   15.0   15.8   19.7   26.000   30.4
In the above process, we have to install the ‘dplyr’ package, and then we will make use of tapply and rbind functions to get the multiple columns of the mtcars datasets.
在上述过程中,我们必须安装' dplyr'软件包,然后将使用tapply和rbind函数来获取mtcars数据集的多个列。
In the above section, we took multiple columns such as ‘mpg’ and the ‘gear’ columns in mtcars data set. Like this, we can compute the quantiles for multiple groups in a data set.
在上一节中,我们在mtcars数据集中采用了多个列,例如“ mpg”和“ gear”列。 这样,我们可以计算数据集中多个组的分位数。
我们可以可视化百分位数吗? (Can we visualise the percentiles?)
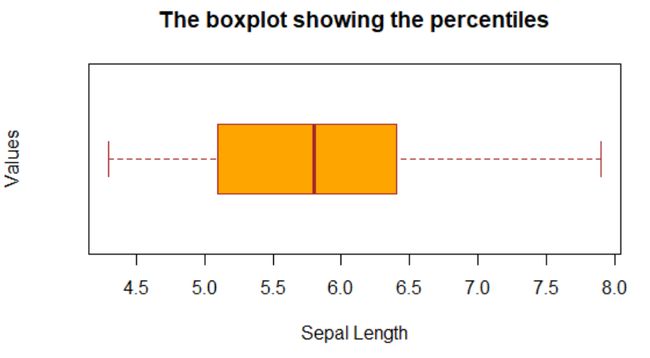
My answer is a big YES!. The best plot for this will be a box plot. Let me take the iris dataset and will try to visualize the box plot which will showcase the percentiles as well.
我的回答是肯定的! 最好的绘图是箱形图。 让我以虹膜数据集为例,尝试使方框图可视化,该方框图还将显示百分位数。
Let’s roll!
来吧!
data(iris)
head(iris)
This is the iris data set with top 6 values.
这是虹膜数据集的前6个值。
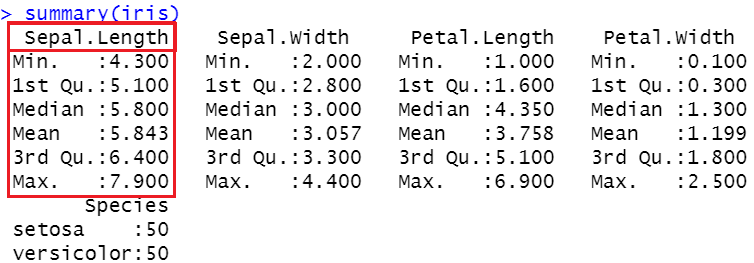
Let’s explore the data with the function named – ‘Summary’.
让我们使用名为“摘要”的函数探索数据。
summary(iris)
In the above image, you can see the mean, median, 25th percentile(1 st quartile), 75 th percentile(3rd percentile) and min and max values as well. Let’s plot this information through a box plot.
在上图中,您可以看到平均值,中位数,第25个百分点(第1个四分位数),第75个百分点(第3个百分点)以及最小值和最大值。 让我们通过箱形图来绘制此信息。
Let’s do it!
我们开始做吧!
#plots a boxplot with labels

boxplot(iris$Sepal.Length,main='The boxplot showing the percentiles',col='Orange',ylab='Values',xlab='Sepal Length',border = 'brown',horizontal = T)
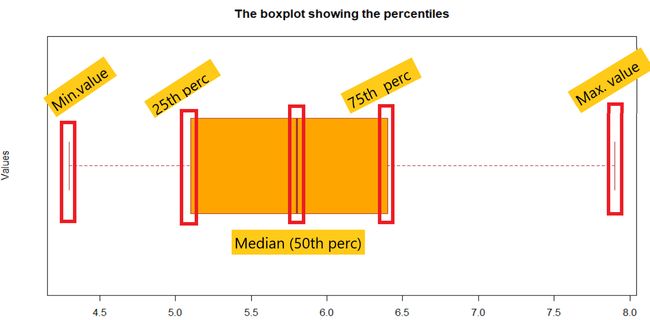
A box plot can show many aspects of the data. In the below figure I have mentioned the particular values represented by the box plots. This will save some time for you and facilitates your understanding in the best way possible.
箱形图可以显示数据的许多方面。 在下图中,我提到了由箱形图表示的特定值。 这将为您节省一些时间,并以最好的方式促进您的理解。
R中的Quantile()函数–总结 (Quantile() function in R – Wrapping up)
Well, it’s a longer article I reckon. And I tried my best to explain and explore the quantile() function in R in multiple dimensions through various examples and illustrations as well. The quantile function is the most useful function in data analysis as it efficiently reveals more information about the given data.
好吧,我认为这是一篇较长的文章。 而且,我也通过各种示例和插图尽力解释和探索了R中的quantile()函数。 分位数功能是数据分析中最有用的功能,因为它可以有效地揭示有关给定数据的更多信息。
I hope you got a good understanding of the buzz around the quantile() function in R. That’s all for now. We will be back with more and more beautiful functions and topics in R programming. Till then take care and happy data analyzing!!!
我希望您对R中的quantile()函数的嗡嗡声有一个很好的了解。仅此而已。 我们将在R编程中返回越来越多的精美函数和主题。 直到小心谨慎并进行愉快的数据分析!!!
More study: R documentation.
更多研究: R文档。
翻译自: https://www.journaldev.com/42025/quantile-function-in-r
quantile函数r语言


