【Python-ML】非线性映射降维-KPCA方法
# -*- coding: utf-8 -*-
'''
Created on 2018年1月18日
@author: Jason.F
@summary: 特征抽取-KPCA方法,核主成分分析方法,RBF核实现
'''
import pandas as pd
import numpy as np
import matplotlib.pyplot as plt
from scipy.spatial.distance import pdist,squareform
from scipy import exp
from scipy.linalg import eigh
from sklearn.datasets import make_moons
from sklearn.datasets import make_circles
from sklearn.decomposition import PCA
from matplotlib.ticker import FormatStrFormatter
def rbf_kernel_pca(X,gama,n_components):
    '''
    RBF kernel PCA implementation.

    Parameters:
    X:{Numpy ndarray},shape=[n_samples,n_features]
    gama:float,Tuning parameter of the RBF kernel
    n_components:int,Number of principal components to return

    Returns:
    X_pc:{Numpy ndarray},shape=[n_samples,n_features],Projected dataset
    '''
    #1:计算样本对欧几里得距离,并生成核矩阵
    #k(x,y)=exp(-gama *||x-y||^2),x和y表示样本,构建一个NXN的核矩阵,矩阵值是样本间的欧氏距离值。
    #1.1:calculate pairwise squared Euclidean distances in the MXN dimensional dataset.
    sq_dists = pdist (X, 'sqeuclidean') #计算两两样本间欧几里得距离

    #1.2:convert pairwise distances into a square matrix.
    mat_sq_dists=squareform(sq_dists) #距离平方

    #1.3:compute the symmetric kernel matrix.
    K=exp(-gama * mat_sq_dists)

    #2:聚集核矩阵K'=K-L*K-K*L + L*K*L,其中L是一个nXn的矩阵(和核矩阵K的维数相同,所有的值都是1/n。
    #聚集核矩阵的必要性是:样本经过标准化处理后,当在生成协方差矩阵并以非线性特征的组合替代点积时,所有特征的均值为0;但用低维点积计算时并没有精确计算新的高维特征空间,也无法确定新特征空间的中心在零点。
    #center the kernel matrix.
    N=K.shape[0]
    one_n = np.ones((N,N))/N #NXN单位矩阵
    K=K - one_n.dot(K) - K.dot(one_n) + one_n.dot(K).dot(one_n)

    #3:对聚集后的核矩阵求取特征值和特征向量
    #obtaining eigenpairs from the centered kernel matrix
    #numpy.eigh returns them in sorted order.
    eigvals,eigvecs = eigh(K)

    #4:选择前k个特征值所对应的特征向量,和PCA不同,KPCA得到的K个特征,不是主成分轴,而是高维映射到低维后的低维特征数量
    #核化过程是低维映射到高维,pca是降维,经过核化后的维度已经不是原来的特征空间。
    #核化是低维映射到高维,但并不是在高维空间计算(非线性特征组合)而是在低维空间计算(点积),做到这点关键是核函数,核函数通过两个向量点积来度量向量间相似度,能在低维空间内近似计算出高维空间的非线性特征空间。
    #collect the top k eigenvectors (projected samples).
    X_pc = np.column_stack((eigvecs[:,-i] for i in range(1,n_components+1)))

    return X_pc

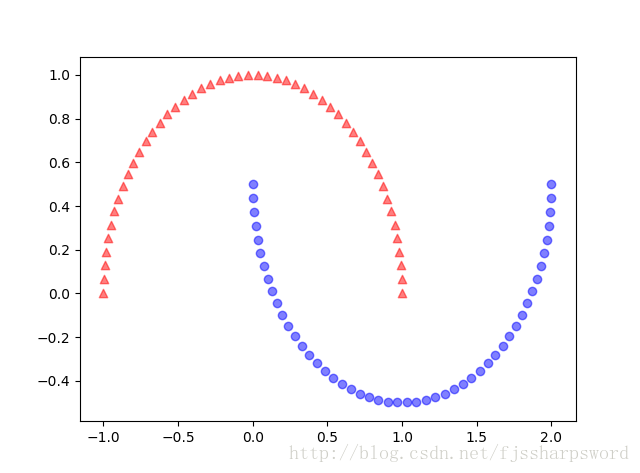
#case1:分离半月形数据
#1.1:生成二维线性不可分数据
X,y=make_moons(n_samples=100,random_state=123)
plt.scatter(X[y==0,0],X[y==0,1],color='red',marker='^',alpha=0.5)
plt.scatter(X[y==1,0],X[y==1,1],color='blue',marker='o',alpha=0.5)
plt.show()
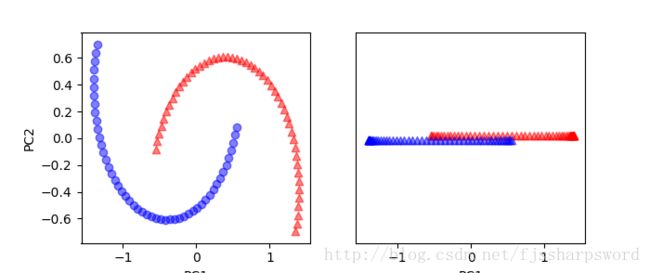
#1.2:PCA降维,映射到主成分,仍不能很好线性分类
sk_pca = PCA(n_components=2)
X_spca=sk_pca.fit_transform(X)
fig,ax = plt.subplots(nrows=1,ncols=2,figsize=(7,3))
ax[0].scatter(X_spca[y==0,0],X_spca[y==0,1],color='red',marker='^',alpha=0.5)
ax[0].scatter(X_spca[y==1,0],X_spca[y==1,1],color='blue',marker='o',alpha=0.5)
ax[1].scatter(X_spca[y==0,0],np.zeros((50,1))+0.02,color='red',marker='^',alpha=0.5)
ax[1].scatter(X_spca[y==1,0],np.zeros((50,1))-0.02,color='blue',marker='^',alpha=0.5)
ax[0].set_xlabel('PC1')
ax[0].set_ylabel('PC2')
ax[1].set_ylim([-1,1])
ax[1].set_yticks([])
ax[1].set_xlabel('PC1')
plt.show()
#1.3:利用基于RBF核的KPCA来实现线性可分
X_kpca=rbf_kernel_pca(X, gama=15, n_components=2)
fig,ax = plt.subplots(nrows=1,ncols=2,figsize=(7,3))
ax[0].scatter(X_kpca[y==0,0],X_kpca[y==0,1],color='red',marker='^',alpha=0.5)
ax[0].scatter(X_kpca[y==1,0],X_kpca[y==1,1],color='blue',marker='o',alpha=0.5)
ax[1].scatter(X_kpca[y==0,0],np.zeros((50,1))+0.02,color='red',marker='^',alpha=0.5)
ax[1].scatter(X_kpca[y==1,0],np.zeros((50,1))-0.02,color='blue',marker='^',alpha=0.5)
ax[0].set_xlabel('PC1')
ax[0].set_ylabel('PC2')
ax[1].set_ylim([-1,1])
ax[1].set_yticks([])
ax[1].set_xlabel('PC1')
ax[0].xaxis.set_major_formatter(FormatStrFormatter('%0.1f'))
ax[1].xaxis.set_major_formatter(FormatStrFormatter('%0.1f'))
plt.show()

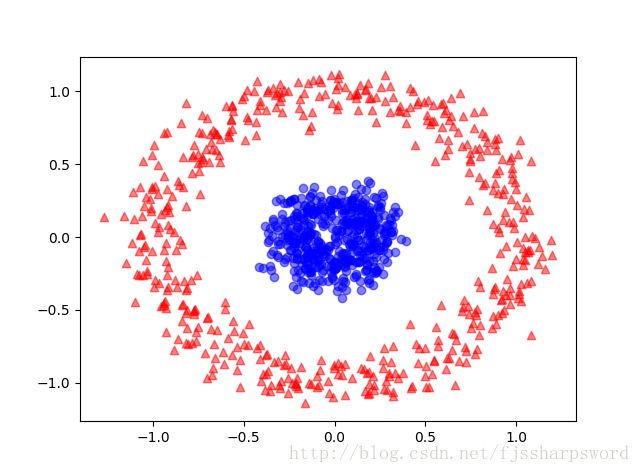
#case2:分离同心圆
#2.1:生成同心圆数据
X,y=make_circles(n_samples=1000,random_state=123,noise=0.1,factor=0.2)
plt.scatter(X[y==0,0],X[y==0,1],color='red',marker='^',alpha=0.5)
plt.scatter(X[y==1,0],X[y==1,1],color='blue',marker='o',alpha=0.5)
plt.show()
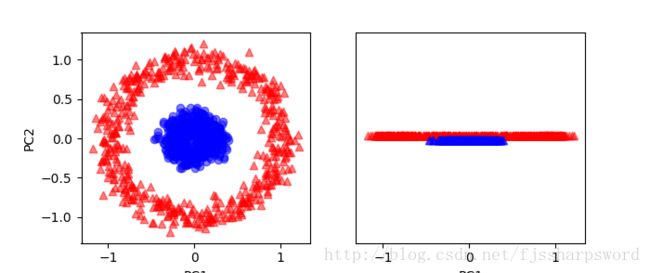
#2.2:标准PCA映射
sk_pca = PCA(n_components=2)
X_spca=sk_pca.fit_transform(X)
fig,ax = plt.subplots(nrows=1,ncols=2,figsize=(7,3))
ax[0].scatter(X_spca[y==0,0],X_spca[y==0,1],color='red',marker='^',alpha=0.5)
ax[0].scatter(X_spca[y==1,0],X_spca[y==1,1],color='blue',marker='o',alpha=0.5)
ax[1].scatter(X_spca[y==0,0],np.zeros((500,1))+0.02,color='red',marker='^',alpha=0.5)
ax[1].scatter(X_spca[y==1,0],np.zeros((500,1))-0.02,color='blue',marker='^',alpha=0.5)
ax[0].set_xlabel('PC1')
ax[0].set_ylabel('PC2')
ax[1].set_ylim([-1,1])
ax[1].set_yticks([])
ax[1].set_xlabel('PC1')
plt.show()
#2.3:RBF-KPCA映射
X_kpca=rbf_kernel_pca(X, gama=15, n_components=2)
fig,ax = plt.subplots(nrows=1,ncols=2,figsize=(7,3))
ax[0].scatter(X_kpca[y==0,0],X_kpca[y==0,1],color='red',marker='^',alpha=0.5)
ax[0].scatter(X_kpca[y==1,0],X_kpca[y==1,1],color='blue',marker='o',alpha=0.5)
ax[1].scatter(X_kpca[y==0,0],np.zeros((500,1))+0.02,color='red',marker='^',alpha=0.5)
ax[1].scatter(X_kpca[y==1,0],np.zeros((500,1))-0.02,color='blue',marker='^',alpha=0.5)
ax[0].set_xlabel('PC1')
ax[0].set_ylabel('PC2')
ax[1].set_ylim([-1,1])
ax[1].set_yticks([])
ax[1].set_xlabel('PC1')
ax[0].xaxis.set_major_formatter(FormatStrFormatter('%0.1f'))
ax[1].xaxis.set_major_formatter(FormatStrFormatter('%0.1f'))
plt.show()
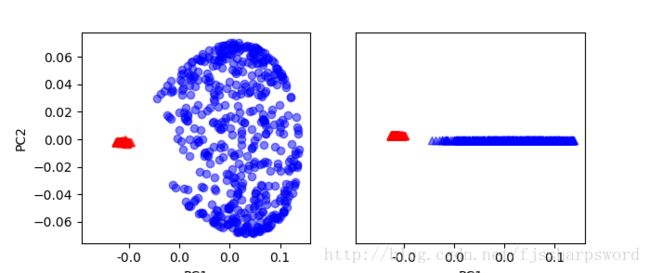
case1结果:
case2结果:
