获取示例数据
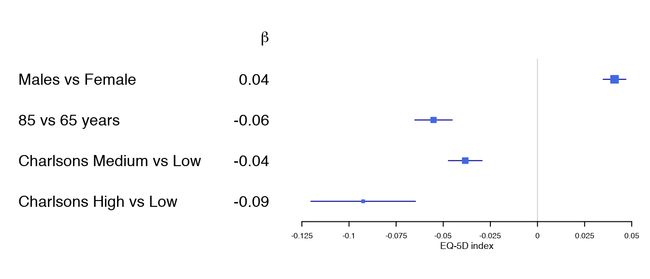
如果能够提供回归分析的结果,特别是使用非ascii字母会很方便。 在本节中,示例数据是研究比较瑞典和丹麦之间进行全髋关节置换术后1年与健康相关的生活质量预后评估的比较:
library(forestplot)
data(HRQoL)
clrs <- fpColors(box="royalblue",line="darkblue", summary="royalblue")
tabletext <-
  list(c(NA, rownames(HRQoL$Sweden)),
       append(list(expression(beta)), sprintf("%.2f", HRQoL$Sweden[,"coef"])))
forestplot(tabletext,
           rbind(rep(NA, 3),
                 HRQoL$Sweden),
           col=clrs,
           xlab="EQ-5D index")
更改字体设置
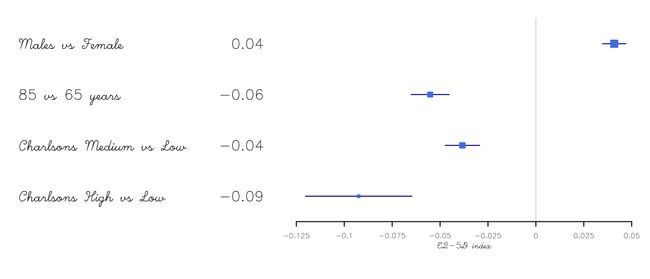
换个字体换种风格:
tabletext <- cbind(rownames(HRQoL$Sweden),
                   sprintf("%.2f", HRQoL$Sweden[,"coef"]))
forestplot(tabletext,
           txt_gp = fpTxtGp(label = gpar(fontfamily = "HersheyScript")),
           rbind(HRQoL$Sweden),
           col=clrs,
           xlab="EQ-5D index")
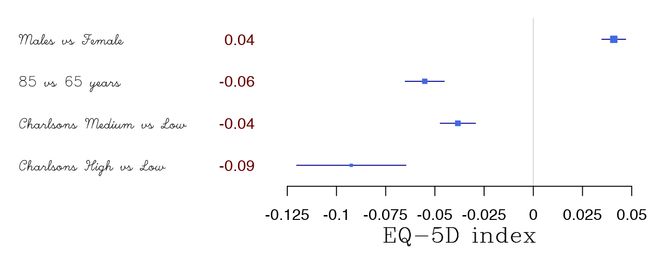
在gp-styles中还有选择的可能性:
forestplot(tabletext,
           txt_gp = fpTxtGp(label = list(gpar(fontfamily = "HersheyScript"),
                                         gpar(fontfamily = "",
                                              col = "#660000")),
                            ticks = gpar(fontfamily = "", cex=1),
                            xlab  = gpar(fontfamily = "HersheySerif", cex = 1.5)),
           rbind(HRQoL$Sweden),
           col=clrs,
           xlab="EQ-5D index")
置信区间
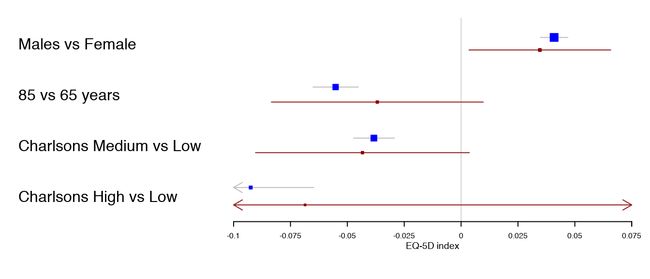
对于不确定的估计,为了保持更感兴趣的估计的分辨率,对区间进行修剪是很方便的。裁剪只是在置信区间中添加一个箭头,请参见下面的最低估计值:
forestplot(tabletext,
           rbind(HRQoL$Sweden),
           clip =c(-.1, Inf),
           col=clrs,
           xlab="EQ-5D index")
多个置信区间
当将相同曝露的相似结果组合在一起时,我发现每行使用多个波段是很有用的。这有效地增加了数据覆盖度,同时使两个波段之间的比较变得微不足道。作者在他的文章通过全髋关节置换术后1年对瑞典和丹麦患者进行了比较。在这里,由于丹麦样本要小得多,所以剪辑也变得很明显,从而产生了更宽的置信区间。
tabletext <- tabletext[,1]
forestplot(tabletext,
           mean = cbind(HRQoL$Sweden[, "coef"], HRQoL$Denmark[, "coef"]),
           lower = cbind(HRQoL$Sweden[, "lower"], HRQoL$Denmark[, "lower"]),
           upper = cbind(HRQoL$Sweden[, "upper"], HRQoL$Denmark[, "upper"]),
           clip =c(-.1, 0.075),
           col=fpColors(box=c("blue", "darkred")),
           xlab="EQ-5D index")
估算指标
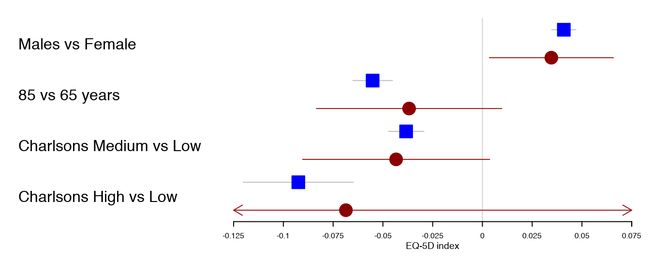
用户可以在多个不同的评估指标之间进行选择。使用上面的示例,我们可以将丹麦语结果设置为圆圈。
forestplot(tabletext,
            fn.ci_norm = c(fpDrawNormalCI, fpDrawCircleCI),
            boxsize = .25, # We set the box size to better visualize the type
            line.margin = .1, # We need to add this to avoid crowding
            mean = cbind(HRQoL$Sweden[, "coef"], HRQoL$Denmark[, "coef"]),
            lower = cbind(HRQoL$Sweden[, "lower"], HRQoL$Denmark[, "lower"]),
            upper = cbind(HRQoL$Sweden[, "upper"], HRQoL$Denmark[, "upper"]),
            clip =c(-.125, 0.075),
            col=fpColors(box=c("blue", "darkred")),
            xlab="EQ-5D index")
置信区间/框绘制功能是完全可定制的。您可以编写自己的函数来接受参数:lower_limit, estimate, upper_limit, size, y.offset, clr.line, clr.marker和 lwd。
选择线型
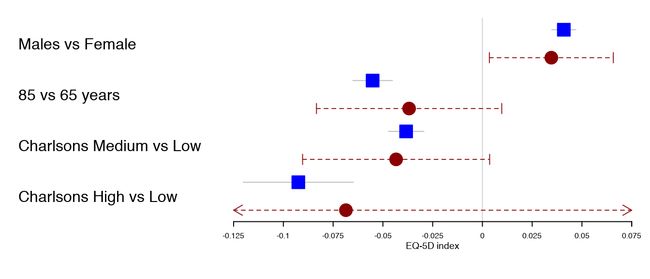
用户还可以通过指定为特定于元素的*lty.ci*命令在所有可用行类型之间进行选择。
forestplot(tabletext,
            fn.ci_norm = c(fpDrawNormalCI, fpDrawCircleCI),
            boxsize = .25, # We set the box size to better visualize the type
            line.margin = .1, # We need to add this to avoid crowding
            mean = cbind(HRQoL$Sweden[, "coef"], HRQoL$Denmark[, "coef"]),
            lower = cbind(HRQoL$Sweden[, "lower"], HRQoL$Denmark[, "lower"]),
            upper = cbind(HRQoL$Sweden[, "upper"], HRQoL$Denmark[, "upper"]),
            clip =c(-.125, 0.075),
            lty.ci = c(1, 2),
            col=fpColors(box=c("blue", "darkred")),
            xlab="EQ-5D index")
Legends
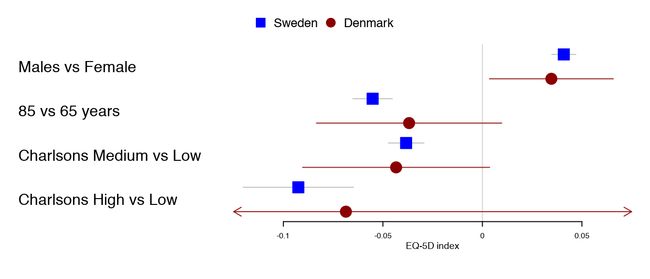
Adding a basic legend is done through the legend argument:
forestplot(tabletext,
           legend = c("Sweden", "Denmark"),
           fn.ci_norm = c(fpDrawNormalCI, fpDrawCircleCI),
           boxsize = .25, # We set the box size to better visualize the type
           line.margin = .1, # We need to add this to avoid crowding
           mean = cbind(HRQoL$Sweden[, "coef"], HRQoL$Denmark[, "coef"]),
           lower = cbind(HRQoL$Sweden[, "lower"], HRQoL$Denmark[, "lower"]),
           upper = cbind(HRQoL$Sweden[, "upper"], HRQoL$Denmark[, "upper"]),
           clip =c(-.125, 0.075),
           col=fpColors(box=c("blue", "darkred")),
           xlab="EQ-5D index")
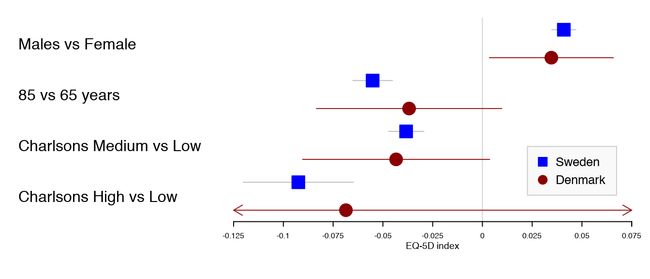
This can be further customized by setting the legend_args argument using the fpLegend function:
forestplot(tabletext,
           legend_args = fpLegend(pos = list(x=.85, y=0.25),
                                  gp=gpar(col="#CCCCCC", fill="#F9F9F9")),
           legend = c("Sweden", "Denmark"),
           fn.ci_norm = c(fpDrawNormalCI, fpDrawCircleCI),
           boxsize = .25, # We set the box size to better visualize the type
           line.margin = .1, # We need to add this to avoid crowding
           mean = cbind(HRQoL$Sweden[, "coef"], HRQoL$Denmark[, "coef"]),
           lower = cbind(HRQoL$Sweden[, "lower"], HRQoL$Denmark[, "lower"]),
           upper = cbind(HRQoL$Sweden[, "upper"], HRQoL$Denmark[, "upper"]),
           clip =c(-.125, 0.075),
           col=fpColors(box=c("blue", "darkred")),
           xlab="EQ-5D index")
刻度和网格
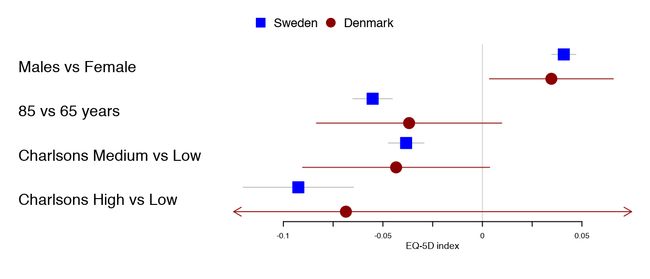
如果默认记号与所需值不匹配,则只需使用xticks参数即可轻松更改这些记号:
forestplot(tabletext,
           legend = c("Sweden", "Denmark"),
           fn.ci_norm = c(fpDrawNormalCI, fpDrawCircleCI),
           boxsize = .25, # We set the box size to better visualize the type
           line.margin = .1, # We need to add this to avoid crowding
           mean = cbind(HRQoL$Sweden[, "coef"], HRQoL$Denmark[, "coef"]),
           lower = cbind(HRQoL$Sweden[, "lower"], HRQoL$Denmark[, "lower"]),
           upper = cbind(HRQoL$Sweden[, "upper"], HRQoL$Denmark[, "upper"]),
           clip =c(-.125, 0.075),
           col=fpColors(box=c("blue", "darkred")),
           xticks = c(-.1, -0.05, 0, .05),
           xlab="EQ-5D index")
通过向刻度添加labels属性,用户可以进一步定制刻度,下面是每隔一个刻度定制刻度文本的示例:
xticks <- seq(from = -.1, to = .05, by = 0.025)
xtlab <- rep(c(TRUE, FALSE), length.out = length(xticks))
attr(xticks, "labels") <- xtlab
forestplot(tabletext,
           legend = c("Sweden", "Denmark"),
           fn.ci_norm = c(fpDrawNormalCI, fpDrawCircleCI),
           boxsize = .25, # We set the box size to better visualize the type
           line.margin = .1, # We need to add this to avoid crowding
           mean = cbind(HRQoL$Sweden[, "coef"], HRQoL$Denmark[, "coef"]),
           lower = cbind(HRQoL$Sweden[, "lower"], HRQoL$Denmark[, "lower"]),
           upper = cbind(HRQoL$Sweden[, "upper"], HRQoL$Denmark[, "upper"]),
           clip =c(-.125, 0.075),
           col=fpColors(box=c("blue", "darkred")),
           xticks = xticks,
           xlab="EQ-5D index")
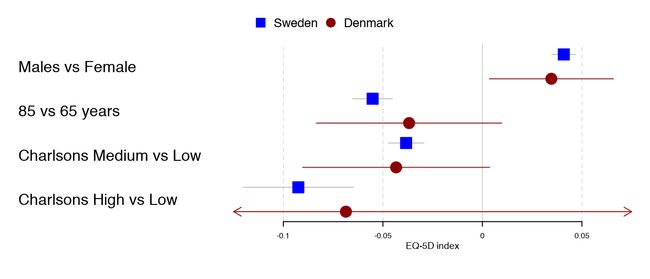
有时,当用户绘制了一个非常高的图形,又想要添加辅助线,以便更容易地看到刻度线。这在非劣势或等价性研究中很有用。则可以通过更改grid参数来实现:
forestplot(tabletext,
           legend = c("Sweden", "Denmark"),
           fn.ci_norm = c(fpDrawNormalCI, fpDrawCircleCI),
           boxsize = .25, # We set the box size to better visualize the type
           line.margin = .1, # We need to add this to avoid crowding
           mean = cbind(HRQoL$Sweden[, "coef"], HRQoL$Denmark[, "coef"]),
           lower = cbind(HRQoL$Sweden[, "lower"], HRQoL$Denmark[, "lower"]),
           upper = cbind(HRQoL$Sweden[, "upper"], HRQoL$Denmark[, "upper"]),
           clip =c(-.125, 0.075),
           col=fpColors(box=c("blue", "darkred")),
           grid = TRUE,
           xticks = c(-.1, -0.05, 0, .05),
           xlab="EQ-5D index")
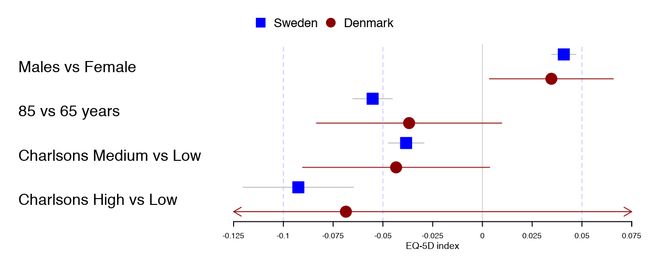
通过将gpar对象添加到矢量中,您可以轻松地自定义要使用的网格线以及网格线的类型:
forestplot(tabletext,
           legend = c("Sweden", "Denmark"),
           fn.ci_norm = c(fpDrawNormalCI, fpDrawCircleCI),
           boxsize = .25, # We set the box size to better visualize the type
           line.margin = .1, # We need to add this to avoid crowding
           mean = cbind(HRQoL$Sweden[, "coef"], HRQoL$Denmark[, "coef"]),
           lower = cbind(HRQoL$Sweden[, "lower"], HRQoL$Denmark[, "lower"]),
           upper = cbind(HRQoL$Sweden[, "upper"], HRQoL$Denmark[, "upper"]),
           clip =c(-.125, 0.075),
           col=fpColors(box=c("blue", "darkred")),
           grid = structure(c(-.1, -.05, .05),
                            gp = gpar(lty = 2, col = "#CCCCFF")),
           xlab="EQ-5D index")
如果您不熟悉结构调用,则相当于生成一个向量,然后设置一个属性,例如:
grid_arg <- c(-.1, -.05, .05)
attr(grid_arg, "gp") <- gpar(lty = 2, col = "#CCCCFF")
identical(grid_arg,
          structure(c(-.1, -.05, .05),
                    gp = gpar(lty = 2, col = "#CCCCFF")))
# Returns TRUE
好了,就这些. 作者希望这个 forestplot 包对你有用.
参考:https://github.com/gforge/forestplot
