服务端性能监控最佳实践(三):Spring Boot Actuator接入到grafana
服务端性能监控最佳实践(三):Spring Boot Actuator接入到grafana
文章目录
- 服务端性能监控最佳实践(三):Spring Boot Actuator接入到grafana
- Spring Boot增加Micrometer组件
- 安装prometheus
- 下载prometheus
- 配置prometheus监控
- 运行prometheus
- 使用grafana
- 使用docker运行grafana
- 增加prometheus数据源
- 结语
上一篇文章中,分享了Spring Boot Actuator这一强大的组件在监控中起到的作用,但如何利用好这些指标,还需要借助两个工具prometheus和grafana。
借助他们,可以将/metrics暴露出的数据,做成可视化图表。组成炫酷的仪表盘,只需要几个简单的步骤。
阅读本文需要三分钟
Spring Boot增加Micrometer组件
要想把metrics数据以标准的格式暴露出去,需要使用Micrometer组件,这个组件可以将数据整合成各种格式,提供给多种数据库使用,如prometheus influxDb等等。
首先配置依赖
<dependency>
  	<groupId>io.micrometergroupId>
  	<artifactId>micrometer-registry-prometheusartifactId>
  	<version>${micrometer.version}version>
dependency>
启动后,它会注册两个类PrometheusMeterRegistry和CollectorRegistry来收集和输出数据。
启动应用后,再次访问/actuator接口,可以看到新增的endpoint
{
    "href": "http://localhost/actuator/prometheus",
    "templated": false
}
这个/actuator/prometheus就是用来对外以http形式提供监控源数据的接口,访问这个接口可以看到
# HELP tomcat_sessions_expired_sessions_total
# TYPE tomcat_sessions_expired_sessions_total counter
tomcat_sessions_expired_sessions_total 0.0
# HELP jvm_buffer_count_buffers An estimate of the number of buffers in the pool
# TYPE jvm_buffer_count_buffers gauge
jvm_buffer_count_buffers{id="direct",} 21.0
jvm_buffer_count_buffers{id="mapped",} 0.0
# HELP process_cpu_usage The "recent cpu usage" for the Java Virtual Machine process
# TYPE process_cpu_usage gauge
process_cpu_usage 0.002699055330634278
# HELP jvm_gc_max_data_size_bytes Max size of old generation memory pool
# TYPE jvm_gc_max_data_size_bytes gauge
jvm_gc_max_data_size_bytes 4.185915392E9
# HELP tomcat_threads_config_max_threads
# TYPE tomcat_threads_config_max_threads gauge
tomcat_threads_config_max_threads{name="http-nio-8080",} 20000.0
# HELP process_files_open_files The open file descriptor count
# TYPE process_files_open_files gauge
process_files_open_files 152.0
# HELP jdbc_connections_active
# TYPE jdbc_connections_active gauge
jdbc_connections_active{name="dataSource",} 0.0
# HELP jvm_memory_used_bytes The amount of used memory
# TYPE jvm_memory_used_bytes gauge
jvm_memory_used_bytes{area="heap",id="PS Survivor Space",} 8.8076056E7
jvm_memory_used_bytes{area="heap",id="PS Old Gen",} 3.53283512E8
jvm_memory_used_bytes{area="heap",id="PS Eden Space",} 4.97038016E8
jvm_memory_used_bytes{area="nonheap",id="Metaspace",} 1.33272872E8
jvm_memory_used_bytes{area="nonheap",id="Code Cache",} 7.8773248E7
jvm_memory_used_bytes{area="nonheap",id="Compressed Class Space",} 1.6486952E7
# HELP jdbc_connections_min
# TYPE jdbc_connections_min gauge
jdbc_connections_min{name="dataSource",} 0.0
# HELP jvm_memory_max_bytes The maximum amount of memory in bytes that can be used for memory management
# TYPE jvm_memory_max_bytes gauge
jvm_memory_max_bytes{area="heap",id="PS Survivor Space",} 8.8080384E7
这种格式是metrics标准格式,可以被收集到prothmetheus中。
安装prometheus
prometheus是一个监控系统,可以采集数据、存储数据、在界面查看数据。
下面我们尝试安装prometheus,建议采用docker的方式运行,一键启动,不需要额外进行编译安装。
下载prometheus
docker pull prom/prometheus
配置prometheus监控
prometheus需要采集哪些接口的数据,是通过一个prometheus.yml文件进行配置的,我们先创建一个prometheus.yml文件。
global:
  scrape_interval:     15s # Set the scrape interval to every 15 seconds. Default is every 1 minute.
  evaluation_interval: 15s # Evaluate rules every 15 seconds. The default is every 1 minute.
  # scrape_timeout is set to the global default (10s).

# Load rules once and periodically evaluate them according to the global 'evaluation_interval'.
rule_files:
  # - "first_rules.yml"
  # - "second_rules.yml"

# A scrape configuration containing exactly one endpoint to scrape:
# Here it's Prometheus itself.
scrape_configs:
  # The job name is added as a label `job=` to any timeseries scraped from this config.
  - job_name: 'spring-actuator'
    metrics_path: '/actuator/prometheus'
    scrape_interval: 5s
    static_configs:
    - targets: ['10.129.16.70:7777']
在最后配置上一个job,配置好地址和url就可以进行监控了,注意targets这里可以填写多个端点,因为一般线上都是集群部署,可以填写所有节点的ip。
运行prometheus
通过docker run 命令启动镜像,注意-v是将我们配置的yml文件复制到容器内部使用,要填写正确外部的文件地址。
docker run -d --name=prometheus-lua -p 9090:9090 -v ~/learn/GitHub/prometheus-lua-nginx/docker/prometheus/prometheus.yml:/etc/prometheus/prometheus.yml zrbcool/prometheus-lua-prom --config.file=/etc/prometheus/prometheus.yml
现在访问http://localhost:9090就可以看到prometheus界面了。
可以输入一些指标如http_server_requests_seconds_count,查看趋势图。
使用grafana
上面我们安装的prometheus可以简单地看一些趋势图,但是没有达到我们想要的炫酷的效果,此时我们要使用另一个工具,grafana,grafana是一个专业的数据可视化系统,能把各种数据源的数据用华丽的效果展示出来(如mysql influxdb prometheus),作为仪表盘使用非常合适。
使用docker运行grafana
grafana无需配置,直接启动使用即可。
docker run -d --name=grafana -p 3000:3000 grafana/grafana
然后访问http://localhost:3000
增加prometheus数据源
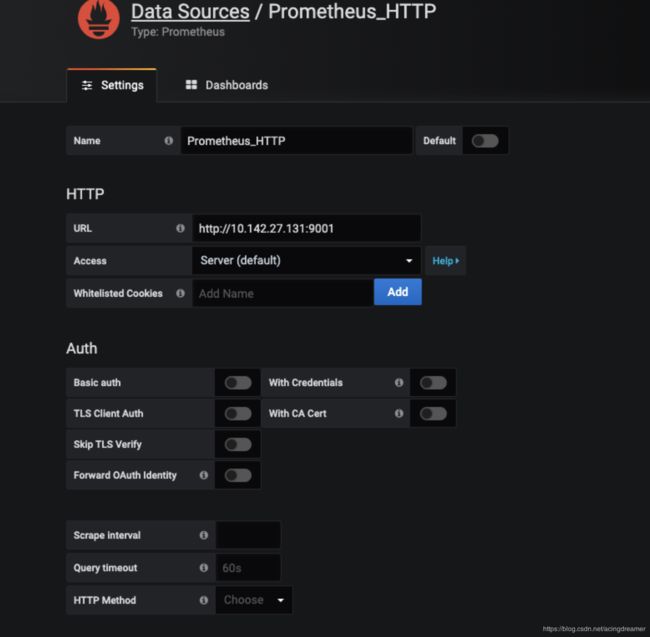
在左侧Configuration->DataSource处进入dataSource管理,添加一个data souce,选择prometheus,将prometheus地址填入url。
然后这个时候,我们需要去配置仪表盘,但自己配置仪表盘需要绘制一个一个的图,比较麻烦,在grafana官网提供了一些样例可以直接导入使用。
下载地址:https://download.csdn.net/download/acingdreamer/12282885
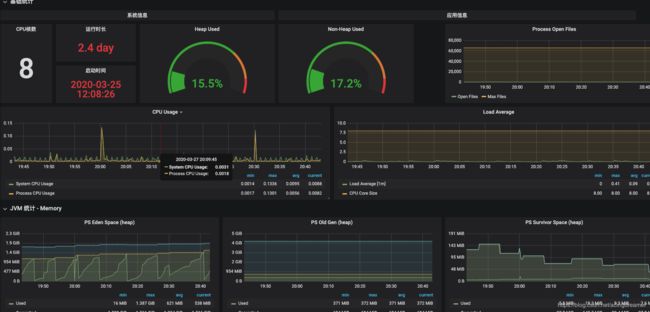
下载json文件后,在左侧的import导入json文件,选择之前新建的datasouce,就可以看到仪表盘数据渲染出来了。
原版数据没有这么多,自己需要的话可以自行添加需要的指标数据,比如我自己又根据需要添加了一些系统信息模块和http模块。需要这个json文件的可以私聊我~
结语
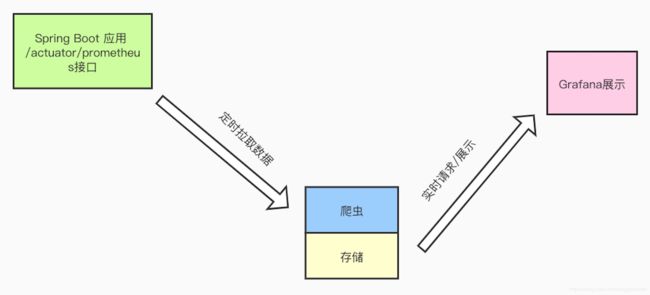
通过上面几个流程,我们可以看到数据是如何采集、存储并展示的,如下图:
通过在Spring Boot中添加Micrometer组件,运行prometheus 和 grafana,这样简单几个步骤就可以对Spring Boot应用的各种指标进行监控,这样对线上情况可以一目了然。包括CPU使用率、内存使用率等等。在此基础上grafana还提供了基于指标自定义报警的功能,在数据异常时通过邮件等方式进行报警,可以自行尝试。
本文首发于重口味博客(http://www.gscoder.cn)


