Power BI Desktop中的分解树
介绍 (Introduction)
Power BI is enriched with many useful visualizations and helps to represent data in various forms. We have explored many use cases of PowerBI in SQLShack articles.
Power BI丰富了许多有用的可视化效果,并有助于表示各种形式的数据。 我们在SQLShack文章中探讨了PowerBI的许多用例。
Microsoft regularly provides updates to Power BI desktop and comes up with new enhancements, features. You should always work with the latest version. In this article, I am using the December 2019 Power BI desktop version.
Microsoft定期提供Power BI桌面的更新,并提供新的增强功能。 您应该始终使用最新版本。 在本文中,我正在使用2019年12月的Power BI桌面版本。
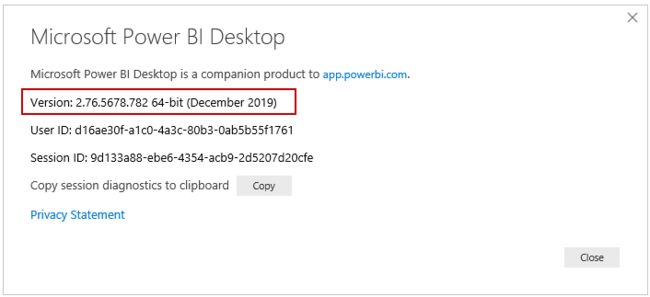
You can check the Power BI desktop from Help->About.
您可以从“ 帮助”->“关于”中检查Power BI桌面。
In November Power BI Desktop release, we have a new decomposition tree visual with the capability of artificial intelligence (AI). Yes, it is having inbuilt AI functionality and helps you to drill down the data.
在Power BI Desktop的11月发行版中,我们有了一个具有人工智能(AI)功能的新的分解树视图。 是的,它具有内置的AI功能,可以帮助您向下钻取数据。
Power BI桌面中的分解树可视化 (Decomposition Tree Visual in Power BI desktop)
We can use the decomposition tree to visualize data in multiple dimensions. We can drill down and analyze data in the hierarchy for a quick analysis. Its’s artificial intelligence (AI) capability enables you to find the next dimension data as per defined criteria. We breakdown (decompose) data into individual categories and determine the high, low values using AI functions in this decomposition visual.
我们可以使用分解树来可视化多维数据。 我们可以向下钻取和分析层次结构中的数据以进行快速分析。 它的人工智能(AI)功能使您能够根据定义的条件查找下一个尺寸数据。 我们将数据分解(分解)为单独的类别,并在此分解视图中使用AI函数确定高值和低值。
It is a preview feature as of now and does not automatically show in the visualization pane.
到目前为止,它是预览功能,不会自动显示在可视化窗格中。
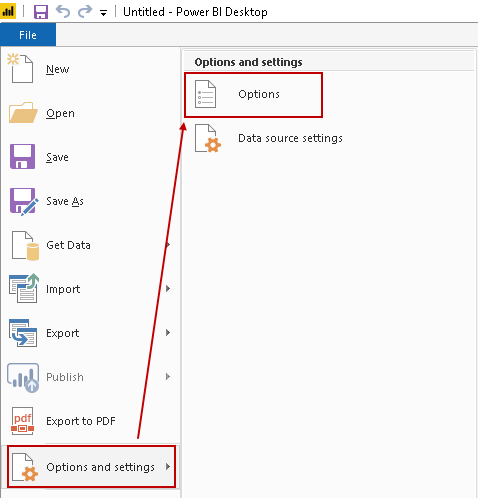
Launch Power BI dashboard and click on File -> Options and settings -> Options:
启动Power BI仪表板,然后单击文件 -> 选项和设置 -> 选项:
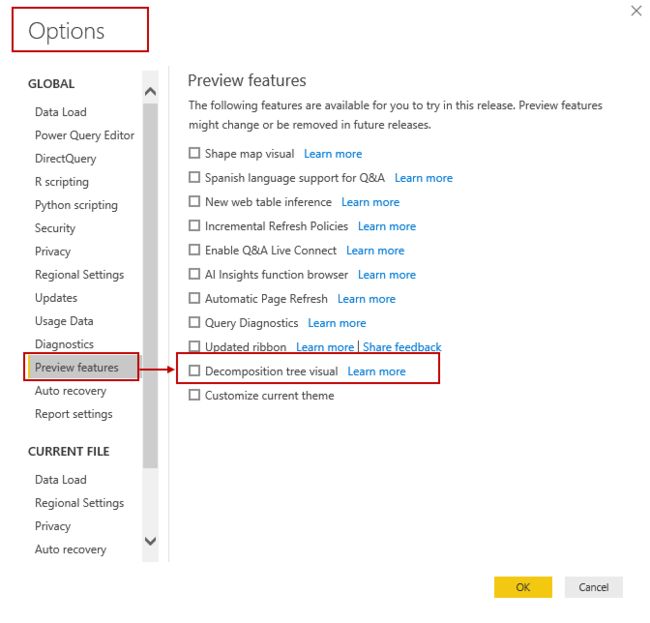
It opens an options page with different configurations. Navigate to the Preview features tab, and you see the checkbox for the Decomposition tree visual feature:
它会打开一个具有不同配置的选项页面。 导航到“ 预览功能”选项卡,然后看到“ 分解树”视觉功能的复选框:
Put a check on the Decomposition tree visual feature and click the OK button:
选中“ 分解树”视觉功能,然后单击“确定”按钮:
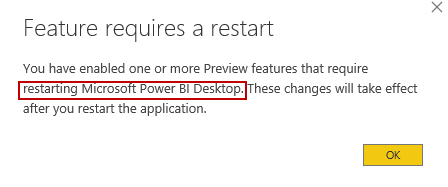
Once you click the OK button, it pops us a message that Power I Desktop restart will enable this preview feature:
单击确定按钮后,它会向我们弹出一条消息,即重启Power I Desktop将启用此预览功能:
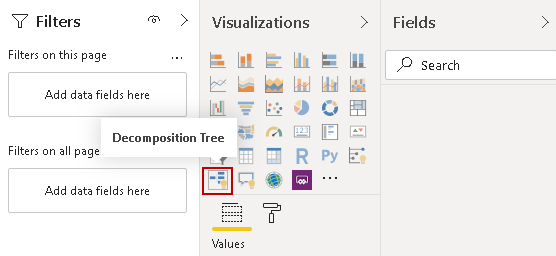
After the restart, you get the Decomposition tree visualization icon as shown below:
重新启动后,您将获得“ 分解树”可视化图标,如下所示:
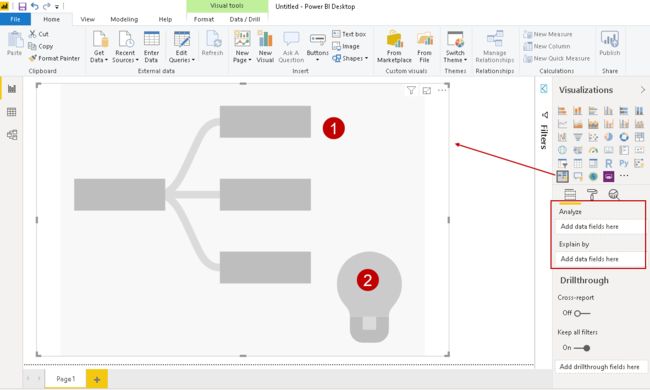
Click on this visual, and it opens the visual layout. You can adjust the layout for a better visual. It consists of two parts – Visual shape and a bulb that represents artificial intelligence:
单击此视觉效果,它将打开视觉效果布局。 您可以调整布局以获得更好的视觉效果。 它由两部分组成-视觉形状和代表人工智能的灯泡:
Decomposition tree requires two inputs:
分解树需要两个输入:
- Analyze: In this input, we specify a column for that you require a breakdown of the tree 分析:在此输入中,我们指定一列,您需要对树进行细分
- Explain by: We can add multiple dimensions in this column. We can analyze tree further using these breakdown columns 解释:我们可以在此列中添加多个维度。 我们可以使用这些细分列进一步分析树
We will use the AdventureWorksDW2017 sample database for this demonstration. If you do not have this database, visit GitHub and download the backup copy of this database.
我们将使用AdventureWorksDW2017示例数据库进行此演示。 如果您没有此数据库,请访问GitHub并下载该数据库的备份副本。
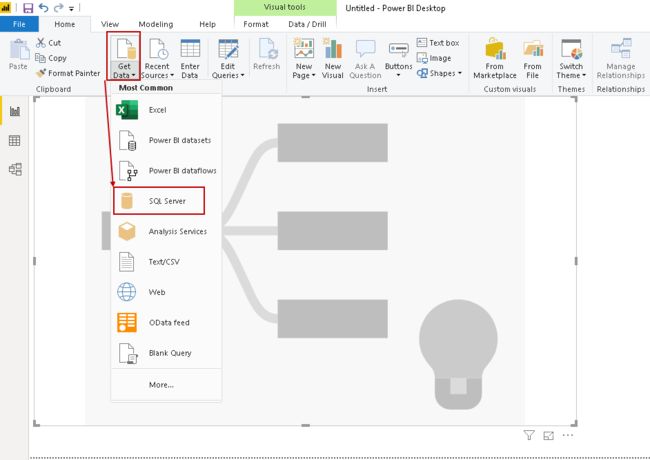
Click on the Get Data button in the Home tab and choose the data source as SQL Server:
单击“ 主页”选项卡中的“ 获取数据”按钮,然后选择数据源作为SQL Server:
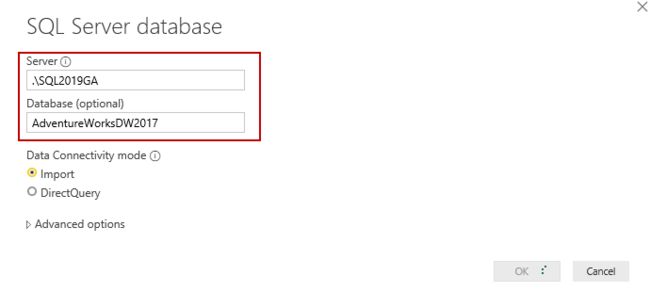
It opens a pop-up window, and you can specify the SQL Server instance, database details. We can specify the Data Connectivity mode, either Import or DirectQuery:
它打开一个弹出窗口,您可以指定SQL Server实例,数据库详细信息。 我们可以指定数据连接模式,即Import或DirectQuery :
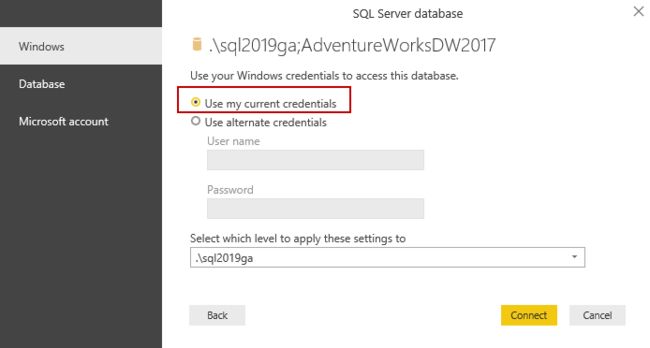
Click the OK button and specify the credentials. We can use either Windows credentials (option – Use my current credentials) or specify alternate credentials:
单击确定按钮,然后指定凭据。 我们可以使用Windows凭据(选项–使用我当前的凭据),也可以指定备用凭据:
You get warning message of unencrypted connection:
您收到未加密连接的警告消息:
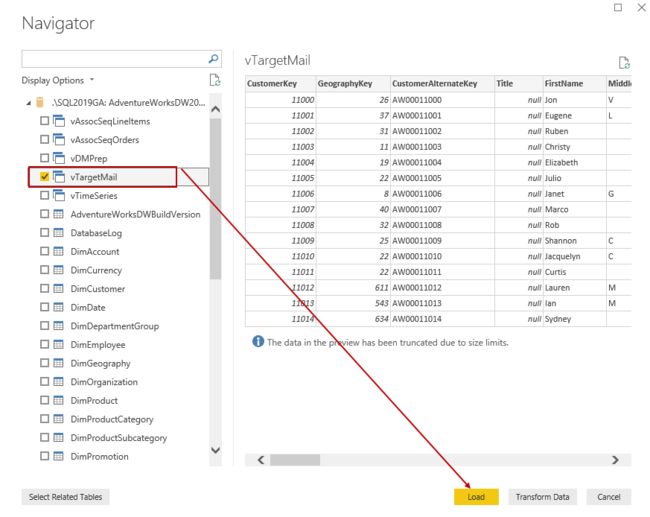
Click the OK button to ignore this. You get a list of database objects after authentication. Select the appropriate object and load it. In this article, we use vTargetMail view of AdventureWorksDW2017 database:
单击确定按钮忽略此。 身份验证后,您将获得数据库对象的列表。 选择适当的对象并加载它。 在本文中,我们使用AdventureWorksDW2017数据库的vTargetMail视图:
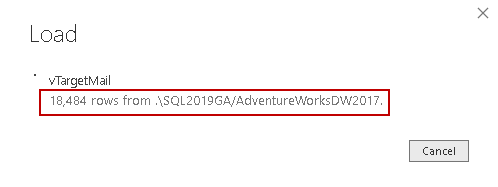
It creates connections and loads data, as shown below:
它创建连接并加载数据,如下所示:
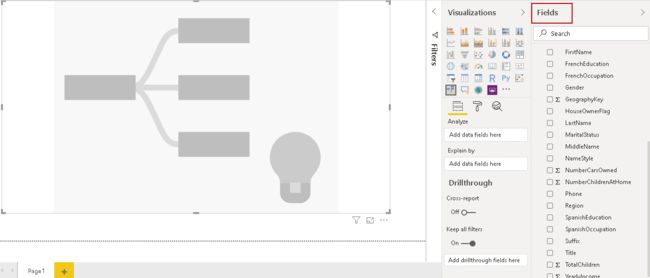
Once the data load is complete, we get the fields (output columns) in the field section of Power BI Desktop:
数据加载完成后,我们将在Power BI Desktop的字段部分中获得字段(输出列):
Now, we need to drag the fields into Analyze and Explain by columns for the decomposition tree. First, drag the [YearlyIncome] field into the Analyze section. It shows the sum of the [YearlyIncome] into the visual:
现在,我们需要将字段拖到分解树的“ 分析”和“ 按列解释”中 。 首先,将[YearlyIncome]字段拖到“ Analyze”部分中。 它显示[YearlyIncome]的总和到视觉中:
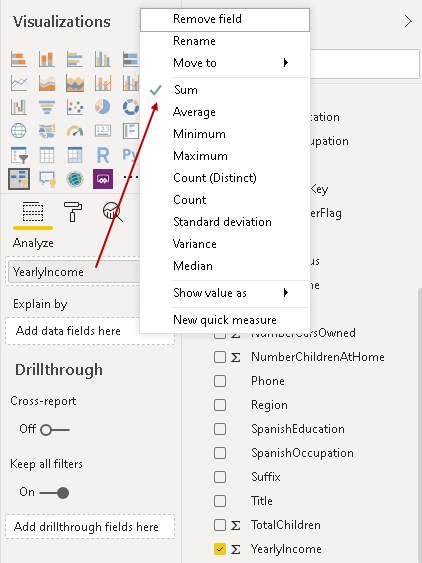
By default, we get the sum for the column in the Analyze column. We can change it as per requirement such as average, minimum, maximum, variance, median, standard deviation. For this article, we can go with the default option sum:
默认情况下,我们获得“ 分析 ”列中该列的总和。 我们可以根据要求进行更改,例如平均值,最小值,最大值,方差,中位数,标准偏差。 对于本文,我们可以使用默认选项sum:
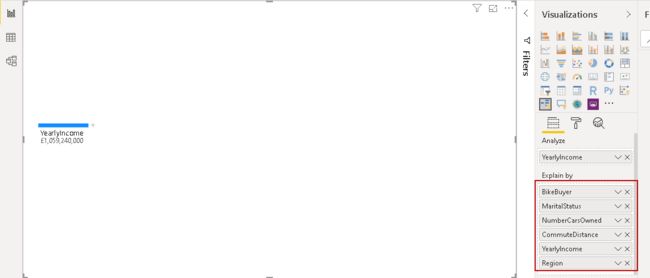
The next requirement is to add the fields to Explain by section. We can add multiple fields in this section. Let’s drag few columns – BikeBuyer, MaritialStatus, NumberCarsOwned, YearlyIncome and CommuteDistance and Region.
下一个要求是将字段添加到“ 按部分解释” 。 我们可以在本节中添加多个字段。 让我们拖几列- BikeBuyer,MaritialStatus,NumberCarsOwned,YearlyIncome和CommuteDistance和地区 。
We can drag the fields in any order. The decomposition chart does not get any influence on the order of columns:
我们可以按任意顺序拖动字段。 分解图对列顺序没有任何影响:
In the above screenshot, we can see that we have selected the fields in explain by column, but it does not show in the decomposition tree visual.
在上面的屏幕截图中,我们可以看到我们已经在“按列解释”中选择了字段,但是它没有显示在分解树视图中。
You can notice a plus (+) symbol on the sum of [YearlyIncome] column in the chart:
您可以在图表的[YearlyIncome]列的总和上看到一个加号(+):
Click on plus (+) icon, and you get columns that we drag into the explain by section. You also get the column order the same as well. If we want to change the order of the columns in which they should appear in the chart, drag those columns in the same order in the explain by section:
单击加号(+)图标,您将获得我们拖入“按说明”部分的列。 您也将获得相同的列顺序。 如果我们要更改列在图表中应显示的顺序,请在“解释依据”部分中以相同的顺序拖动这些列:
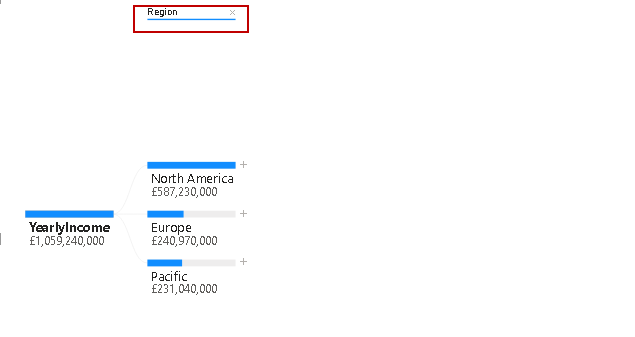
Now, from the chart column, click on any column for adding details in the chart. Let’s click on the Region, and it adds regions into the chart.
现在,在图表列中,单击任意列以在图表中添加详细信息。 让我们单击Region ,它将区域添加到图表中。
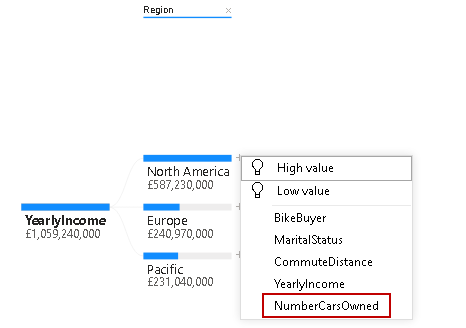
Now, to add further details, click on plus (+) sign on the region and it again populates rest of the fields list:
现在,要添加更多详细信息,请单击该区域上的加号(+),然后再次填充其余字段列表:
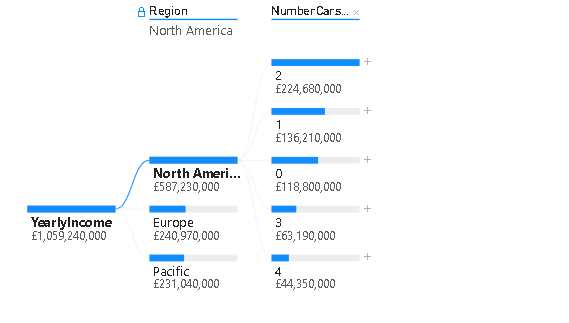
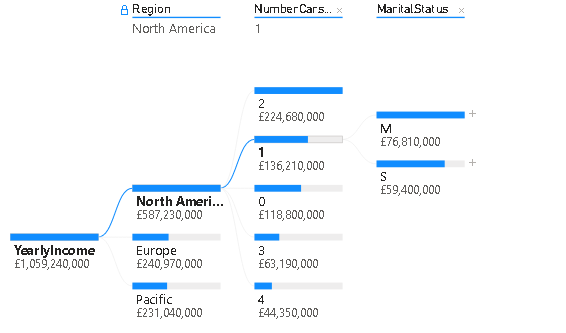
Click on the [NumberCarsOwned], and you get it in the chart. In the below chart, you can see [NumberCarsOwned] for North America:
单击[NumberCarsOwned] ,然后将其显示在图表中。 在下面的图表中,您可以看到北美的[NumberCarsOwned] :
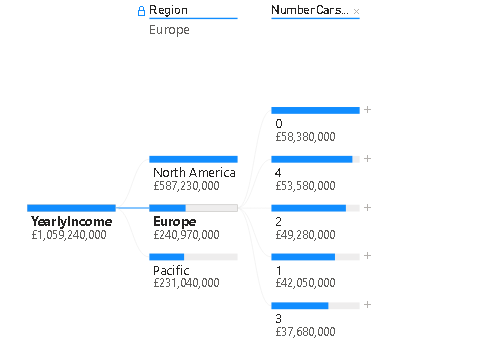
Click on Europe, and you get details of it:
单击欧洲,您将获得详细信息:
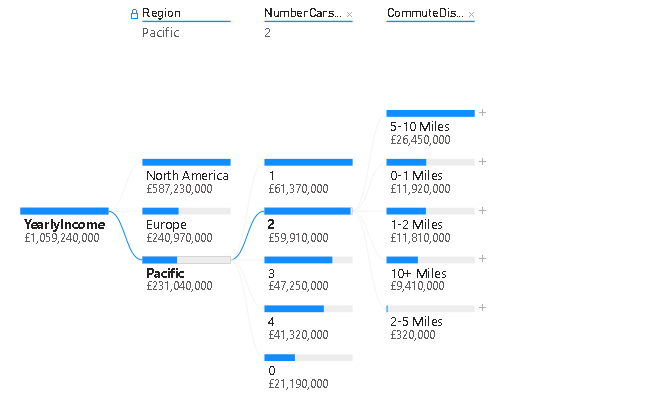
Similarly, we can add further details to the decomposition tree:
同样,我们可以向分解树添加更多细节:
We added further details for [MaritialStatus] in the decomposition tree:
我们在分解树中添加了[MaritialStatus]的更多详细信息:
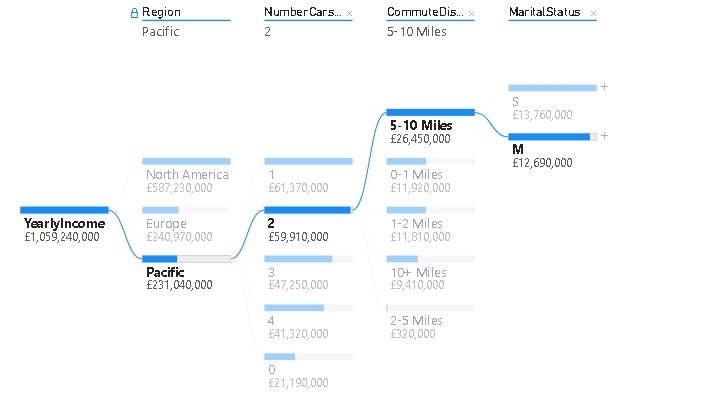
Once you click on any tree path, it highlights that particular path and fades color for others, as shown below:
单击任何树路径后,它将突出显示该特定路径,并为其他路径淡化颜色,如下所示:
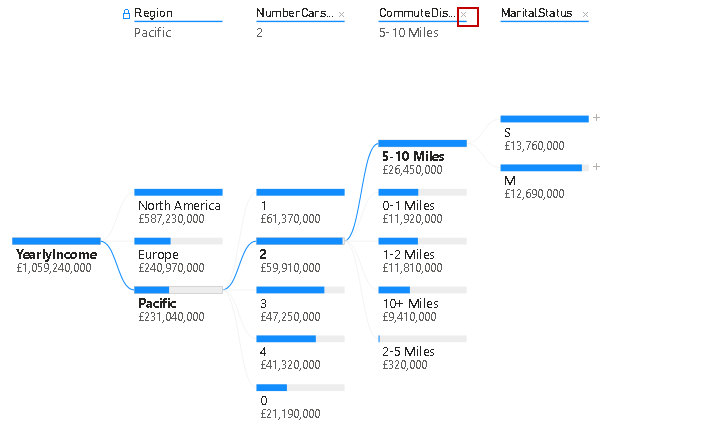
In case we do not want any particular level in the tree, we can remove it as well. For example, let’s say we do not want [CommuteDistance] section, then click on cross (x) on from the top layer:
如果我们不需要树中的任何特定级别,也可以将其删除。 例如,假设我们不想要[CommuteDistance]部分,然后从顶层单击十字(x):
It removes the field, and the decomposition tree automatically relates to the next level that is [MaritialStatus] in my example:
它删除该字段,并且分解树自动与下一个级别相关,在我的示例中为[MaritialStatus] :
Power BI Desktop中的人工智能分解树拆分 (Artificial Intelligence decomposition tree split in Power BI Desktop)
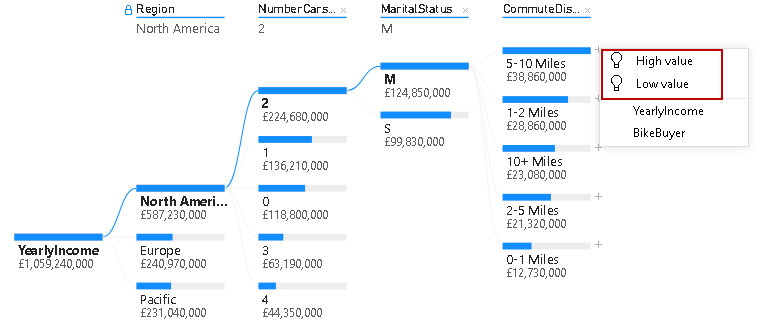
As highlighted earlier, Microsoft added artificial intelligence (AI) as well in the decomposition tree visual. Once we click on plus (+) symbol, we get a list of columns along with two fields having bulb icon as well as shown below:
如前所述,Microsoft在分解树视图中还添加了人工智能(AI)。 单击加号(+)后,我们将获得一列列表以及两个带有灯泡图标的字段,如下所示:
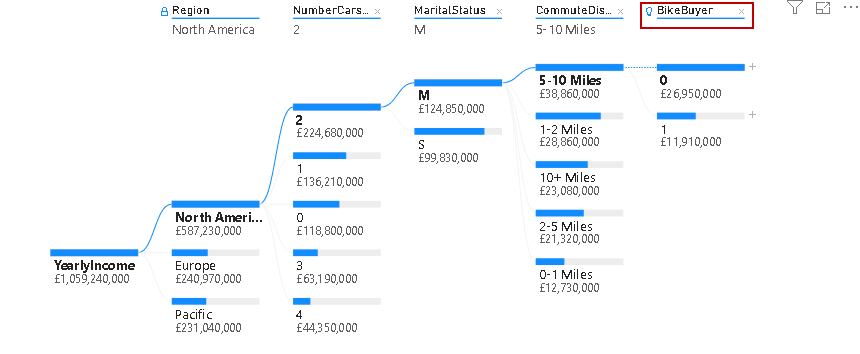
Let’s click on the high value and view the visual. It adds a new split [BikeBuyer] along with a bulb icon indicating that it is an AI split:
让我们单击较高的值并查看视觉效果。 它将添加一个新的拆分[BikeBuyer]以及一个灯泡图标,指示它是一个AI拆分:
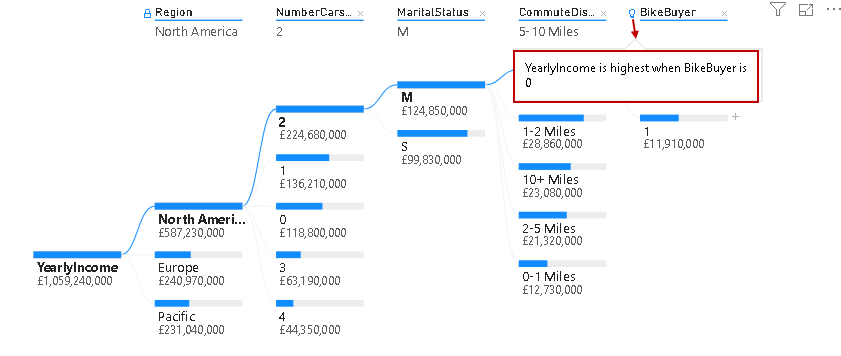
You might think why it added this column into the decomposition tree. It gives you an answer for it as well in the visual. Hover your mouse to the bulb icon, and you get the answer:
您可能会想为什么将此列添加到分解树中。 它在视觉上也为您提供了答案。 将鼠标悬停在灯泡图标上,您会得到答案:
Our decomposition tree starting point is [YearlyIncome]. Once we use AI split in the tree, it finds the way to find out the highest [YearlyIncome] with available elements.
我们的分解树的起点是[YearlyIncome] 。 一旦我们在树中使用AI split,它就会找到找出具有可用元素的最高[YearlyIncome]的方法 。
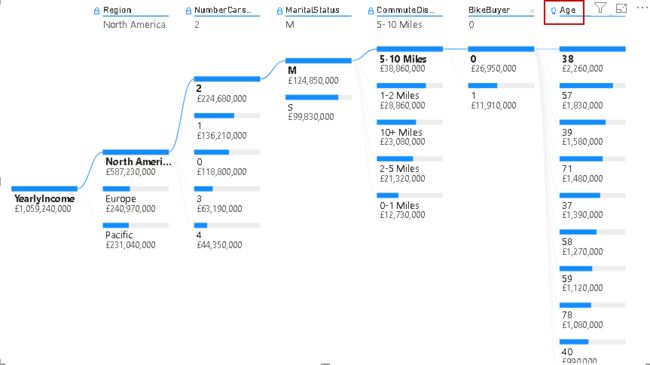
Now, add another column [Age] into explain by section and remove the [YearlyIncome]. Let’s add another high value (AI) split from the [BikeBuyer] AI column:
现在,在“说明”部分中添加另一列[年龄]并删除[YearlyIncome] 。 让我们从[BikeBuyer] AI列中添加另一个高价值(AI):
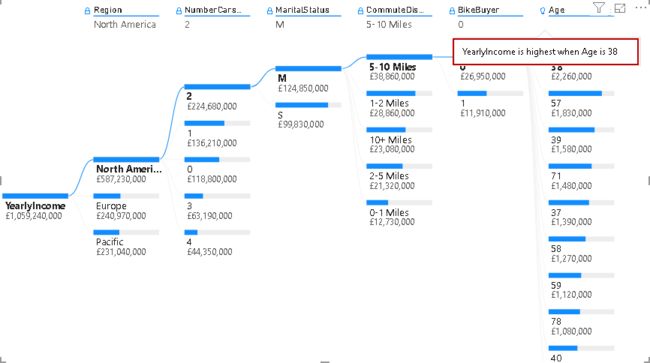
Once we hover mouse on bulb icon for Age, we get the answer of this AI split. [YearlyIncome] is highest when Age is 38:
一旦将鼠标悬停在Age的灯泡图标上,我们就会得到此AI拆分的答案。 [YearlyIncome]是最高时年龄是38:
Now, remove this Age AI split and click on Low Value field. It automatically checks for the lowest yearly income based on Age:
现在,删除此年龄 AI拆分,然后单击“ 低值”字段。 它会根据年龄自动检查最低的年收入:
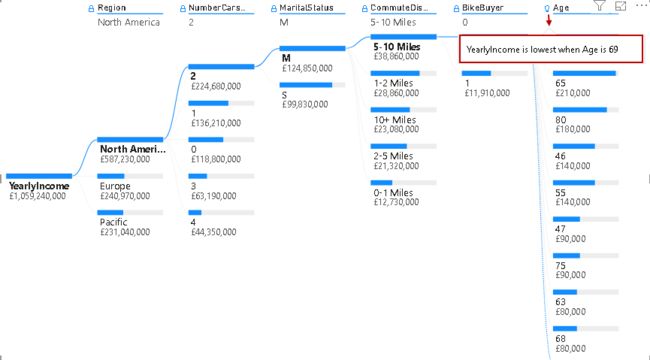
It dynamically calculates the value for the selections. For example, once we change the selection to the Europe region, we can see the lowest yearly income when Age is 66:
它动态计算选择的值。 例如,一旦将选择范围更改为欧洲地区,则可以看到年龄为66岁时的最低年收入:
人工智能分析类型 (Artificial intelligence Analysis type)
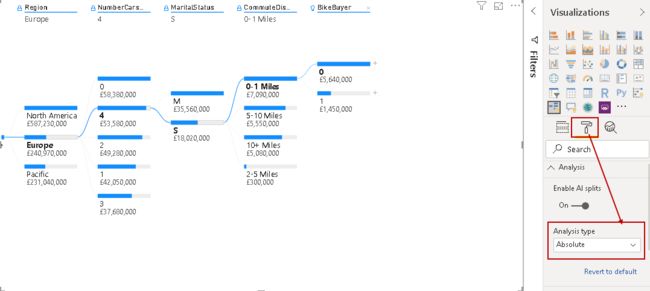
By default, the Decomposition tree analyzes the AI value mode as Absolute. We can view it from the chart format options:
默认情况下,分解树将AI值模式分析为Absolute 。 我们可以从图表格式选项中查看它:
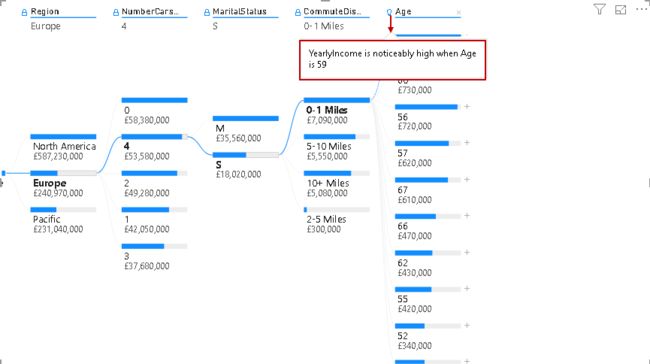
Let’s change the AI split mode from Absolute to Relative. It changes the AI split in the decomposition tree. You get the answer of the calculation – YearlyIncome is noticeably high when Age is 59:
让我们将AI拆分模式从绝对更改为相对 。 它更改了分解树中的AI拆分。 您得到了计算的答案–当年龄为59岁时,年收入很高:
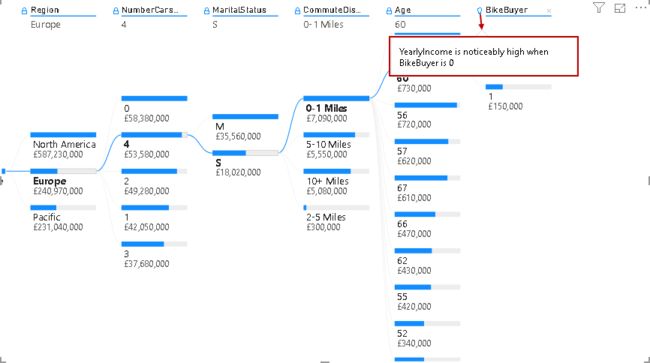
In the Relative mode, add a new high value AI column, and you see that it adds the Age column as shown below:
在相对模式下,添加一个新的高价值AI列,您会看到它添加了Age列,如下所示:
You can see the answer- YearlyIncome is noticeably high when BikeBuyer is 0. You can compare this with the absolute AI mode in which we get the same calculations at first place. You should use the required AI mode as per your requirements. We can add high value and low value in the same decomposition tree. As shown below, we added another low value AI split:
您可以看到答案 -BikeBuyer为0时, YearlyIncome很高。您可以将其与绝对AI模式进行比较,在绝对AI模式下,我们首先获得相同的计算结果。 您应该根据需要使用所需的AI模式。 我们可以在同一分解树中添加高值和低值。 如下所示,我们添加了另一个低值AI拆分:
Power BI Desktop中分解树的锁定行为 (Locking behavior for decomposition tree in Power BI Desktop)
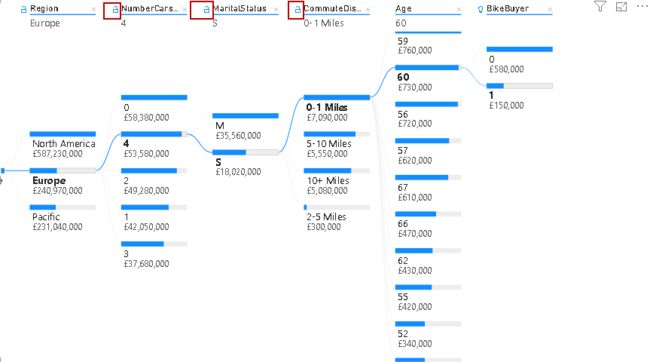
You can notice a small lock icon in the report. By default, the lock is opened for all levels:
您会在报告中注意到一个小的锁定图标。 默认情况下,将为所有级别打开锁:
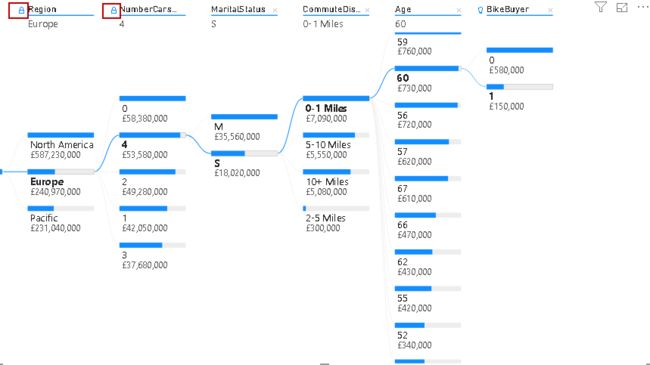
What is the lock in the decomposition tree? Power BI Desktop allows the content creator to lock the level so that the user cannot remove it. Suppose we want to lock first two levels of the tree, click on the open lock icon and it changes to lock as shown below:
分解树中的锁是什么? Power BI Desktop允许内容创建者锁定级别,以便用户无法删除它。 假设我们要锁定树的前两个级别,请单击打开锁定图标,它将变为锁定,如下所示:
Once we lock any level, users do not get any option to remove that level. You do not get a cross (x) icon to remove the level.
一旦我们锁定了任何级别,用户就没有任何选择来删除该级别。 您没有得到一个十字(x)图标来删除该级别。
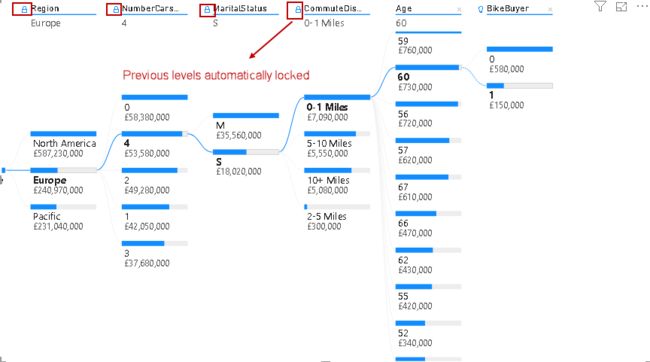
We can lock many levels, but suppose we lock level 4; then, it automatically locks the previous level for you.
我们可以锁定许多级别,但是假设我们锁定了4级。 然后,它会自动为您锁定上一个级别。
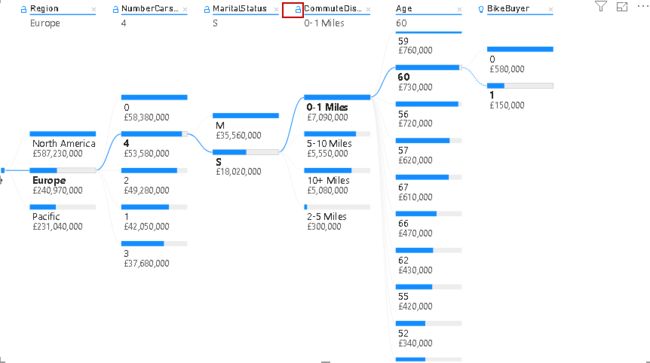
For example, in the following screenshot, we have all the lock levels open:
例如,在以下屏幕截图中,我们打开了所有锁定级别:
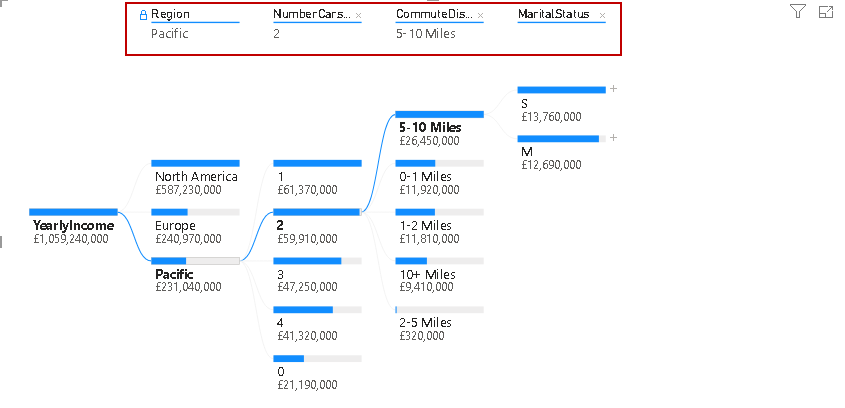
Let’s lock level for [CommuteDistance] and notice that all previous levels locked automatically:
让我们锁定[CommuteDistance]的级别,并注意所有先前的级别都会自动锁定:
Power BI Desktop中分解树的限制 (Limitations of the decomposition tree in Power BI Desktop)
- We can have a maximum of 50 levels in a decomposition tree 分解树中最多可以包含50个级别
- It supports maximum 5000 data points at one time in the tree 在树中一次最多支持5000个数据点
- It does not support On-premises Analysis Services, Power BI Report Server, Direct Query, Azure Analysis Services 它不支持本地分析服务,Power BI报表服务器,直接查询,Azure分析服务
- We cannot use features Q&A, Power BI Mobile, Show Data functionality, and Pinning to dashboard with the decomposition tree 我们无法使用功能Q&A,Power BI Mobile,显示数据功能以及通过分解树固定到仪表板
- It is a preview feature while writing this article and it might have few feature changes in the upcoming releases of Power BI Dashboard 它是撰写本文时的预览功能,在以后的Power BI Dashboard版本中可能没有多少功能更改
结论 (Conclusion)
In this article, we explored the useful decomposition tree and its useful artificial intelligence (AI) features. It is an excellent visual for breakdown data into certain levels and performs root cause analysis.
在本文中,我们探索了有用的分解树及其有用的人工智能(AI)功能。 它是将故障数据划分为一定级别并执行根本原因分析的绝佳视觉效果。
翻译自: https://www.sqlshack.com/the-decomposition-tree-in-power-bi-desktop/
