模式识别与机器学习作业——SVM(支持向量机)
SVM
- Homework 3
- 报告
- Problem 1
- Problem 2
- 代码
- 线性SVM
- 非线性可分SVM
- 学习笔记
- 参考内容
Homework 3
报告
Problem 1
In this problem, we will write a program to implement the SVM algorithm. Let us start with a toy example (which can be found at SVM_matlab_Prof_olga_Veksler.pdf) and then work on more complicated cases. The toy example (credit goes to Prof. Olga Veksler, University of Western Ontario) provides detailed implementation of SVM using Matlab. It is noted that this example works in the original feature space, rather than the augmented one.
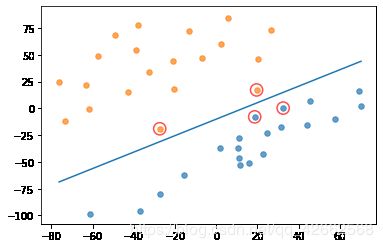
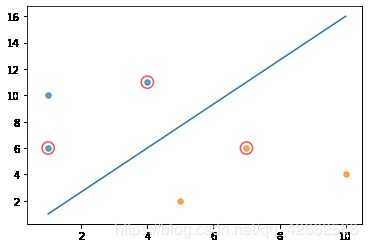
(a) (5 points) Try the toy example, and plot the separating hyperplane g ( x ) = w t x + w 0 g(x) = w^tx+w_0 g(x)=wtx+w0 and the support vectors.
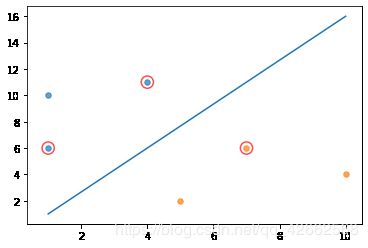
S M O SMO SMO algorithm steps:
Step 1: Calculate the error
E i = f ( x i ) − y i = ∑ j = 1 n α j y j x i T x j + b − y i E_{i}=f\left(x_{i}\right)-y_{i}=\sum_{j=1}^{n} \alpha_{j} y_{j} x_{i}^{T} x_{j}+b-y_{i} Ei=f(xi)−yi=j=1∑nαjyjxiTxj+b−yi
Step 2: Calculate the upper and lower limits L L L and H H H
{ L = max ( 0 , α j o l d − α i o l d ) , H = min ( C , C + α j o l d − α i o l d ) if y i ≠ y j L = max ( 0 , α j o l d + α i o l d − C ) , H = min ( C , α j o l d + α i o l d ) if y i = y j \left\{\begin{array}{l} L=\max \left(0, \alpha_{j}^{o l d}-\alpha_{i}^{o l d}\right), H=\min \left(C, C+\alpha_{j}^{o l d}-\alpha_{i}^{o l d}\right) \text { if } y_{i} \neq y_{j} \\ L=\max \left(0, \alpha_{j}^{o l d}+\alpha_{i}^{o l d}-C\right), H=\min \left(C, \alpha_{j}^{o l d}+\alpha_{i}^{o l d}\right) \text { if } y_{i}=y_{j} \end{array}\right. {L=max(0,αjold−αiold),H=min(C,C+αjold−αiold) if yi=yjL=max(0,αjold+αiold−C),H=min(C,αjold+αiold) if yi=yj
Step 3: Calculate η η η
η = x i T x i + x j T x j − 2 x i T x j \eta=x_{i}^{T} x_{i}+x_{j}^{T} x_{j}-2 x_{i}^{T} x_{j} η=xiTxi+xjTxj−2xiTxj
Step 4: Update α j α_j αj
α j n e w = α j o l d + y j ( E i − E j ) η \alpha_{j}^{n e w}=\alpha_{j}^{o l d}+\frac{y_{j}\left(E_{i}-E_{j}\right)}{\eta} αjnew=αjold+ηyj(Ei−Ej)
Step 5: Clip α j α_j αj according to the value range
α new,clipped = { H if α 2 new ≥ H α 2 new if L ≤ α 2 new ≤ H L if α 2 new ≤ L \alpha^{\text {new,clipped}}=\left\{\begin{array}{lr} H & \text { if } \alpha_{2}^{\text {new}} \geq H \\ \alpha_{2}^{\text {new}} & \text {if } L \leq \alpha_{2}^{\text {new}} \leq H \\ L & \text {if } \alpha_{2}^{\text {new}} \leq L \end{array}\right. αnew,clipped=⎩⎨⎧Hα2newL if α2new≥Hif L≤α2new≤Hif α2new≤L
Step 6: Update α i \alpha_i αi
α i new = α i old + y i y j ( α j old − α j new , clipped ) \alpha_{i}^{\text {new}}=\alpha_{i}^{\text {old}}+y_{i} y_{j}\left(\alpha_{j}^{\text {old}}-\alpha_{j}^{\text {new}, \text {clipped}}\right) αinew=αiold+yiyj(αjold−αjnew,clipped)
Step 7: Update b 1 b_1 b1 and b 2 b_2 b2
b 1 new = b old − E i − y i ( α i new − α i old ) x i T x i − y j ( α j new − α j old ) x j T x i b 2 new = b old − E j − y i ( α i new − α i old ) x i T x j − y j ( α j new − α j old ) x j T x j \begin{aligned} b_{1}^{\text {new}}=b^{\text {old}}-E_{i}-y_{i}\left(\alpha_{i}^{\text {new}}-\alpha_{i}^{\text {old}}\right) x_{i}^{T} x_{i}-y_{j}\left(\alpha_{j}^{\text {new}}\right. \left.-\alpha_{j}^{\text {old}}\right) x_{j}^{T} x_{i} \\ b_{2}^{\text {new}}=b^{\text {old}}-E_{j}-y_{i}\left(\alpha_{i}^{\text {new}}-\alpha_{i}^{\text {old}}\right) x_{i}^{T} x_{j}-y_{j}\left(\alpha_{j}^{\text {new}}\right. \left.-\alpha_{j}^{\text {old}}\right) x_{j}^{T} x_{j} \end{aligned} b1new=bold−Ei−yi(αinew−αiold)xiTxi−yj(αjnew−αjold)xjTxib2new=bold−Ej−yi(αinew−αiold)xiTxj−yj(αjnew−αjold)xjTxj
Step 8: Update b according to b 1 b_1 b1 and b 2 b_2 b2
b = { b 1 0 < α 1 n e w < C b 2 0 < α 2 n e w < C b 1 + b 2 2 otherwise b=\left\{\begin{array}{ll} b_{1} & 0<\alpha_{1}^{n e w}
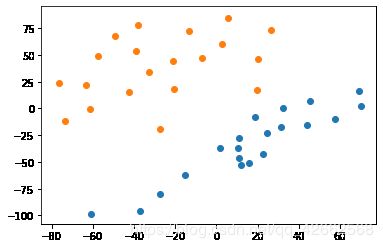
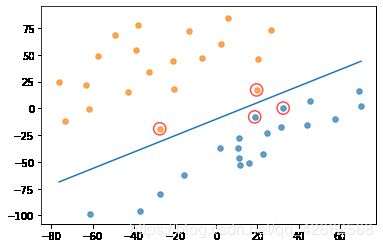
(b) (10 points) Train a SVM classifier with TrainSet1.txt*, and plot the separating hyperplane and the support vectors.
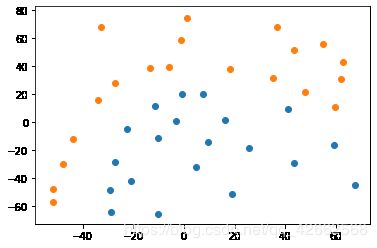
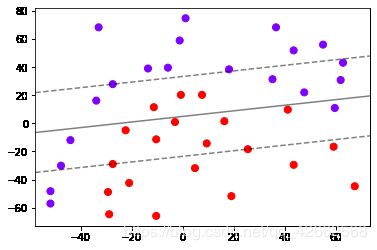
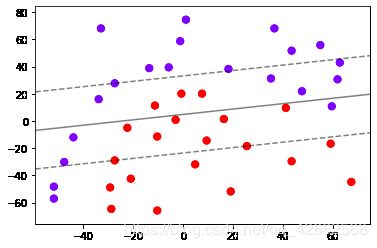
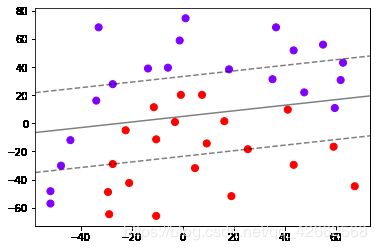
© (15 points) Design a quadratic kernel and train a SVM classi er with TrainSet2.txt. Plot the separating boundary and support vectors in the original feature space.
Problem 2
DHS p276-Problem 33 (p225-33 in the translated book).
(Hint for (b): You may use the original feature space rather than the augmented feature space.)
This problem asks you to follow the Kuhn-Tucker theorem to convert the con-strained optimization problem in Support Vector Machines into a dual, unconstrained one. For SVMs, the goal is to find the minimum length weight vector a a a subject to the (classification) constraints
z k a t y k ≥ 1 k = 1 , … , n z_{k} \mathbf{a}^{t} \mathbf{y}_{k} \geq 1 \quad k=1, \ldots, n zkatyk≥1k=1,…,n
where z k = ± 1 z_k = ±1 zk=±1 indicates the target category of each of the n n n patterns y k y_k yk . Note that a a a and y y y are augmented (by a 0 a_0 a0 and y 0 = 1 y_0 = 1 y0=1, respectively).
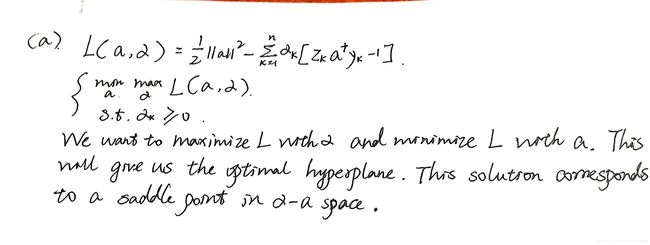
(a) Consider the unconstrained optimization associated with S V M S SVMS SVMS:
L ( a , α ) = 1 2 ∥ a ∥ 2 − ∑ k = 1 n α k [ z k a t y k − 1 ] L(\mathbf{a}, \boldsymbol{\alpha})=\frac{1}{2}\|\mathbf{a}\|^{2}-\sum_{k=1}^{n} \alpha_{k}\left[z_{k} \mathbf{a}^{t} \mathbf{y}_{k}-1\right] L(a,α)=21∥a∥2−k=1∑nαk[zkatyk−1]
In the space determined by the components of a, and the n (scalar) undetermined multipliers α k , the desired solution is a saddle point, rather than a global maximum or minimum. Explain.
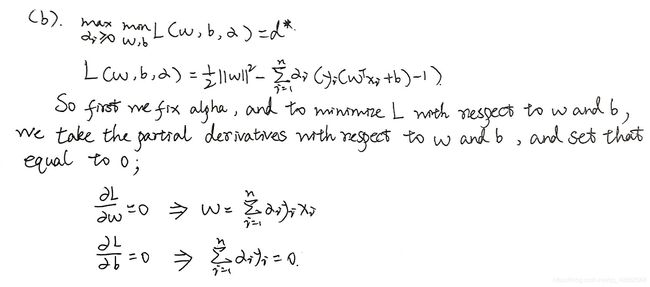
(b)Next eliminate the dependency of this (“primal”) functional upon a a a, i.e., reformulated the optimization in a dual form, by the following steps. Note that at the saddle point of the primal functional, we have
∂ L ( a ∗ , α ∗ ) ∂ a = 0 \frac{\partial L\left(\mathbf{a}^{*}, \boldsymbol{\alpha}^{*}\right)}{\partial \mathbf{a}}=0 ∂a∂L(a∗,α∗)=0
Solve for the partial derivatives and conclude
∑ k = 1 n α k ∗ z k = 0 α k ∗ ≥ 0 , k = 1 , … n \sum_{k=1}^{n} \alpha_{k}^{*} z_{k}=0 \quad \alpha_{k}^{*} \geq 0, k=1, \ldots n k=1∑nαk∗zk=0αk∗≥0,k=1,…n
© The second derivative vanishing implies
KaTeX parse error: Undefined control sequence: \ at position 111: …\mathbf{y}_{k} \̲ ̲
and thus
KaTeX parse error: Undefined control sequence: \ at position 2: \̲ ̲\mathbf{a}_{r}=…
since ∑ k = 1 n α k z k = 0 , \sum_{k=1}^{n} \alpha_{k} z_{k}=0, ∑k=1nαkzk=0, we can thus write the solution in augmented form as
KaTeX parse error: Undefined control sequence: \ at position 2: \̲ ̲\mathbf{a}=\sum…

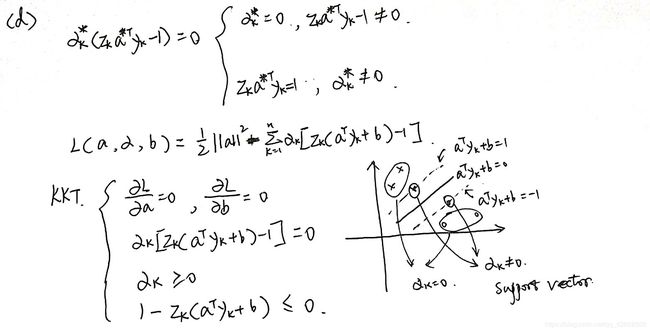
(d) According to the Kuhn-Tucker theorem (cf. Bibliography), an undetermined multiplier α k ∗ \alpha_{k}^{*} αk∗ is non-zero only if the corresponding sample y k \mathbf{y}_{k} yk satisfies z k ( a t y k + 1 ) ≥ 1. z_{k} (\mathbf{a}^{t} \mathbf{y}_{k}+1)\geq1. zk(atyk+1)≥1. Show that this can be expressed as
KaTeX parse error: Undefined control sequence: \ at position 2: \̲ ̲\alpha_{k}^{*}\…
(The samples where α k ∗ \alpha_{k}^{*} αk∗ are nonzero, i.e., z k a t y k = 1 , z_{k} \mathbf{a}^{t} \mathbf{y}_{k}=1, zkatyk=1, are the support vectors.)
(e) Use the results from parts ( b ) − ( c ) (\mathrm{b})-(\mathrm{c}) (b)−(c) to eliminate the weight vector in the functional, and thereby construct the dual functional
KaTeX parse error: Undefined control sequence: \ at position 2: \̲ ̲\tilde{L}(\math…

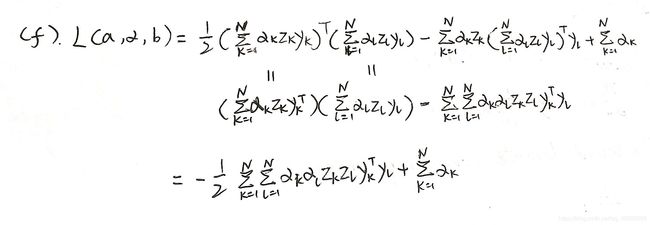
(f) Substitute the solution a* from part © to find the dual functional
KaTeX parse error: Undefined control sequence: \ at position 2: \̲ ̲\tilde{L}(\bold…
代码
线性SVM
import time
import matplotlib.pyplot as plt
import numpy as np
import random
import types
import math
# 读取数据
def loadDataSet(fileName):
    dataMat = [] # 数据矩阵
    labelMat = [] # 标签矩阵
    file = open(fileName)
    for line in file.readlines():  #逐行读取,滤除空格等
        lineArr = line.strip().split('\t')
        dataMat.append([float(lineArr[0]), float(lineArr[1])])  #添加数据
        labelMat.append(float(lineArr[2]))  #添加标签
    return dataMat, labelMat
# 数据可视化
def showDataSet(dataMat, labelMat):
    """
    dataMat:数据矩阵
    labelMat:数据标签
    """
    data_plus = []  #正样本
    data_minus = []  #负样本
    for i in range(len(dataMat)):
        if labelMat[i] > 0:
            data_plus.append(dataMat[i])
        else:
            data_minus.append(dataMat[i])
    data_plus_np = np.array(data_plus)  #转换为numpy矩阵
    data_minus_np = np.array(data_minus)  #转换为numpy矩阵
    plt.scatter(np.transpose(data_plus_np)[0],
                np.transpose(data_plus_np)[1])  #正样本散点图
    plt.scatter(
        np.transpose(data_minus_np)[0],
        np.transpose(data_minus_np)[1])  #负样本散点图
    plt.show()
# 随机选择alpha
def selectJrand(alpha, n):
    '''
    alpha: 拉格朗日乘子
    n: alpha参数个数
    '''
    j = alpha
    while (j == alpha):
        j = int(random.uniform(0, n))
    return j
# 修剪alpha
def clipAlpha(aj, H, L):
    '''
    aj: alpha值
    H: alpha上界
    L: alpha下界
    '''
    if aj > H:
        aj = H
    if L > aj:
        aj = L
    return aj
The S M O SMO SMO algorithm steps:
Step 1: Calculate the error
E i = f ( x i ) − y i = ∑ j = 1 n α j y j x i T x j + b − y i E_{i}=f\left(x_{i}\right)-y_{i}=\sum_{j=1}^{n} \alpha_{j} y_{j} x_{i}^{T} x_{j}+b-y_{i} Ei=f(xi)−yi=j=1∑nαjyjxiTxj+b−yi
Step 2: Calculate the upper and lower limits L L L and H H H
{ L = max ( 0 , α j o l d − α i o l d ) , H = min ( C , C + α j o l d − α i o l d ) if y i ≠ y j L = max ( 0 , α j o l d + α i o l d − C ) , H = min ( C , α j o l d + α i o l d ) if y i = y j \left\{\begin{array}{l} L=\max \left(0, \alpha_{j}^{o l d}-\alpha_{i}^{o l d}\right), H=\min \left(C, C+\alpha_{j}^{o l d}-\alpha_{i}^{o l d}\right) \text { if } y_{i} \neq y_{j} \\ L=\max \left(0, \alpha_{j}^{o l d}+\alpha_{i}^{o l d}-C\right), H=\min \left(C, \alpha_{j}^{o l d}+\alpha_{i}^{o l d}\right) \text { if } y_{i}=y_{j} \end{array}\right. {L=max(0,αjold−αiold),H=min(C,C+αjold−αiold) if yi=yjL=max(0,αjold+αiold−C),H=min(C,αjold+αiold) if yi=yj
Step 3: Calculate η η η
η = x i T x i + x j T x j − 2 x i T x j \eta=x_{i}^{T} x_{i}+x_{j}^{T} x_{j}-2 x_{i}^{T} x_{j} η=xiTxi+xjTxj−2xiTxj
Step 4: Update α j α_j αj
α j n e w = α j o l d + y j ( E i − E j ) η \alpha_{j}^{n e w}=\alpha_{j}^{o l d}+\frac{y_{j}\left(E_{i}-E_{j}\right)}{\eta} αjnew=αjold+ηyj(Ei−Ej)
Step 5: Clip α j α_j αj according to the value range
α new,clipped = { H if α 2 new ≥ H α 2 new if L ≤ α 2 new ≤ H L if α 2 new ≤ L \alpha^{\text {new,clipped}}=\left\{\begin{array}{lr} H & \text { if } \alpha_{2}^{\text {new}} \geq H \\ \alpha_{2}^{\text {new}} & \text {if } L \leq \alpha_{2}^{\text {new}} \leq H \\ L & \text {if } \alpha_{2}^{\text {new}} \leq L \end{array}\right. αnew,clipped=⎩⎨⎧Hα2newL if α2new≥Hif L≤α2new≤Hif α2new≤L
Step 6: Update α i \alpha_i αi
α i new = α i old + y i y j ( α j old − α j new , clipped ) \alpha_{i}^{\text {new}}=\alpha_{i}^{\text {old}}+y_{i} y_{j}\left(\alpha_{j}^{\text {old}}-\alpha_{j}^{\text {new}, \text {clipped}}\right) αinew=αiold+yiyj(αjold−αjnew,clipped)
Step 7: Update b 1 b_1 b1 and b 2 b_2 b2
b 1 new = b old − E i − y i ( α i new − α i old ) x i T x i − y j ( α j new − α j old ) x j T x i b 2 new = b old − E j − y i ( α i new − α i old ) x i T x j − y j ( α j new − α j old ) x j T x j \begin{aligned} b_{1}^{\text {new}}=b^{\text {old}}-E_{i}-y_{i}\left(\alpha_{i}^{\text {new}}-\alpha_{i}^{\text {old}}\right) x_{i}^{T} x_{i}-y_{j}\left(\alpha_{j}^{\text {new}}\right. \left.-\alpha_{j}^{\text {old}}\right) x_{j}^{T} x_{i} \\ b_{2}^{\text {new}}=b^{\text {old}}-E_{j}-y_{i}\left(\alpha_{i}^{\text {new}}-\alpha_{i}^{\text {old}}\right) x_{i}^{T} x_{j}-y_{j}\left(\alpha_{j}^{\text {new}}\right. \left.-\alpha_{j}^{\text {old}}\right) x_{j}^{T} x_{j} \end{aligned} b1new=bold−Ei−yi(αinew−αiold)xiTxi−yj(αjnew−αjold)xjTxib2new=bold−Ej−yi(αinew−αiold)xiTxj−yj(αjnew−αjold)xjTxj
Step 8: Update b according to b 1 b_1 b1 and b 2 b_2 b2
b = { b 1 0 < α 1 n e w < C b 2 0 < α 2 n e w < C b 1 + b 2 2 otherwise b=\left\{\begin{array}{ll} b_{1} & 0<\alpha_{1}^{n e w}
# SMO算法实现
def smoSimple(dataMatIn, classLabels, C, toler, maxIter):
    '''
    dataMatIn: 数据矩阵
    classLabels: 标签矩阵
    C: 惩罚因子
    tole: 松弛变量
    maxIter: 最大迭代次数
    '''
    #转换为numpy的mat存储
    dataMatrix = np.mat(dataMatIn)
    labelMat = np.mat(classLabels).transpose()
    #初始化b参数
    b = 0
    #统计dataMatrix的维度
    m, n = np.shape(dataMatrix)
    #初始化alpha参数,设为0
    alphas = np.mat(np.zeros((m, 1)))
    #初始化迭代次数
    iter_num = 0
    #最多迭代matIter次
    while (iter_num < maxIter):
        alphaPairsChanged = 0
        for i in range(m):
            #步骤1:计算误差Ei
            fXi = float(
                np.multiply(alphas, labelMat).T *
                (dataMatrix * dataMatrix[i, :].T)) + b
            Ei = fXi - float(labelMat[i])
            #优化alpha,并设定一定的容错率。
            if ((labelMat[i] * Ei < -toler) and
                (alphas[i] < C)) or ((labelMat[i] * Ei > toler) and
                                     (alphas[i] > 0)):
                #随机选择另一个与alpha_i成对优化的alpha_j
                j = selectJrand(i, m)
                #步骤1:计算误差Ej
                fXj = float(
                    np.multiply(alphas, labelMat).T *
                    (dataMatrix * dataMatrix[j, :].T)) + b
                Ej = fXj - float(labelMat[j])
                #保存更新前的aplpha值,使用深拷贝
                alphaIold = alphas[i].copy()
                alphaJold = alphas[j].copy()
                #步骤2:计算上下界L和H
                if (labelMat[i] != labelMat[j]):
                    L = max(0, alphas[j] - alphas[i])
                    H = min(C, C + alphas[j] - alphas[i])
                else:
                    L = max(0, alphas[j] + alphas[i] - C)
                    H = min(C, alphas[j] + alphas[i])
                if L == H:
                    continue
                #步骤3:计算eta
                eta = 2.0 * dataMatrix[i, :] * dataMatrix[j, :].T - dataMatrix[
                    i, :] * dataMatrix[i, :].T - dataMatrix[j, :] * dataMatrix[
                        j, :].T
                if eta >= 0:
                    continue
                #步骤4:更新alpha_j
                alphas[j] -= labelMat[j] * (Ei - Ej) / eta
                #步骤5:修剪alpha_j
                alphas[j] = clipAlpha(alphas[j], H, L)
                if (abs(alphas[j] - alphaJold) < 0.00001):
                    continue
                #步骤6:更新alpha_i
                alphas[i] += labelMat[j] * labelMat[i] * (alphaJold -
                                                          alphas[j])
                #步骤7:更新b_1和b_2
                b1 = b - Ei - labelMat[i] * (
                    alphas[i] - alphaIold
                ) * dataMatrix[i, :] * dataMatrix[i, :].T - labelMat[j] * (
                    alphas[j] -
                    alphaJold) * dataMatrix[i, :] * dataMatrix[j, :].T
                b2 = b - Ej - labelMat[i] * (
                    alphas[i] - alphaIold
                ) * dataMatrix[i, :] * dataMatrix[j, :].T - labelMat[j] * (
                    alphas[j] -
                    alphaJold) * dataMatrix[j, :] * dataMatrix[j, :].T
                #步骤8:根据b_1和b_2更新b
                if (0 < alphas[i]) and (C > alphas[i]): b = b1
                elif (0 < alphas[j]) and (C > alphas[j]): b = b2
                else: b = (b1 + b2) / 2.0
                #统计优化次数
                alphaPairsChanged += 1
        #更新迭代次数
        if (alphaPairsChanged == 0): iter_num += 1
        else: iter_num = 0
    return b, alphas
# 分类结果可视化
def showClassifer(dataMat, w, b):
    """
    dataMat: 数据矩阵
    w: 直线法向量
    b: 直线截距
    """
    #绘制样本点
    data_plus = []  #正样本
    data_minus = []  #负样本
    for i in range(len(dataMat)):
        if labelMat[i] > 0:
            data_plus.append(dataMat[i])
        else:
            data_minus.append(dataMat[i])
    data_plus_np = np.array(data_plus)  #转换为numpy矩阵
    data_minus_np = np.array(data_minus)  #转换为numpy矩阵
    plt.scatter(np.transpose(data_plus_np)[0],
                np.transpose(data_plus_np)[1],
                s=30,
                alpha=0.7)  #正样本散点图
    plt.scatter(np.transpose(data_minus_np)[0],
                np.transpose(data_minus_np)[1],
                s=30,
                alpha=0.7)  #负样本散点图
    #绘制直线
    x1 = max(dataMat)[0]
    x2 = min(dataMat)[0]
    a1, a2 = w
    b = float(b)
    a1 = float(a1[0])
    a2 = float(a2[0])
    y1, y2 = (-b - a1 * x1) / a2, (-b - a1 * x2) / a2
    plt.plot([x1, x2], [y1, y2])
    #找出支持向量点,并可视化
    for i, alpha in enumerate(alphas):
        if alpha > 0:
            x, y = dataMat[i]
            plt.scatter([x], [y],
                        s=150,
                        c='none',
                        alpha=0.7,
                        linewidth=1.5,
                        edgecolor='red')
    plt.show()
# 计算w
def get_w(dataMat, labelMat, alphas):
    """
    dataMat: 数据矩阵
    labelMat: 标签矩阵
    alphas: alpha值
    """
    alphas, dataMat, labelMat = np.array(alphas), np.array(dataMat), np.array(
        labelMat) # 转为numpy数组
    w = np.dot((np.tile(labelMat.reshape(1, -1).T, (1, 2)) * dataMat).T,
               alphas) # 根据公式计算
    return w.tolist()
path = 'C:/Users/86187/Desktop/HW3_data/'
dataMat, labelMat = loadDataSet(path + 'TrainSet1.txt')
showDataSet(dataMat, labelMat)
b,alphas = smoSimple(dataMat, labelMat, 0.6, 0.001, 50)
w = get_w(dataMat, labelMat, alphas)
showClassifer(dataMat, w, b)
# Toy sample
dataMat = [[1, 6], [1, 10], [4, 11], [5, 2], [7, 6], [10, 4]]
labelMat = np.transpose([1, 1, 1, -1, -1, -1])
b, alphas = smoSimple(dataMat, labelMat, 0.6, 0.001, 40)
w = get_w(dataMat, labelMat, alphas)
showClassifer(dataMat, w, b)
非线性可分SVM
import numpy as np
from numpy import linalg
import matplotlib.pyplot as plt
from sklearn.svm import SVC
%matplotlib inline
# 加上这两行可以一次性输出多个变量而不用print
from IPython.core.interactiveshell import InteractiveShell
InteractiveShell.ast_node_interactivity = "all"
# 读取数据
def loadDataSet(fileName):
    dataMat = [] # 数据矩阵
    labelMat = [] # 标签矩阵
    file = open(fileName)
    for line in file.readlines():  #逐行读取,滤除空格等
        lineArr = line.strip().split('\t')
        dataMat.append([float(lineArr[0]), float(lineArr[1])])  #添加数据
        labelMat.append(float(lineArr[2]))  #添加标签
    return dataMat, labelMat
# 数据可视化
def showDataSet(dataMat, labelMat):
    """
    dataMat:数据矩阵
    labelMat:数据标签
    """
    data_plus = []  #正样本
    data_minus = []  #负样本
    for i in range(len(dataMat)):
        if labelMat[i] > 0:
            data_plus.append(dataMat[i])
        else:
            data_minus.append(dataMat[i])
    data_plus_np = np.array(data_plus)  #转换为numpy矩阵
    data_minus_np = np.array(data_minus)  #转换为numpy矩阵
    plt.scatter(np.transpose(data_plus_np)[0],
                np.transpose(data_plus_np)[1])  #正样本散点图
    plt.scatter(
        np.transpose(data_minus_np)[0],
        np.transpose(data_minus_np)[1])  #负样本散点图
    plt.show()
# 数据可视化观察
path = 'C:/Users/86187/Desktop/HW3_data/'
X, y = loadDataSet(path + 'TrainSet2.txt')
showDataSet(X, y)
def plot_svc_decision_function(model,ax=None):
    if ax is None:
        ax = plt.gca()
    xlim = ax.get_xlim()
    ylim = ax.get_ylim()

    x = np.linspace(xlim[0],xlim[1],30)
    y = np.linspace(ylim[0],ylim[1],30)
    Y,X = np.meshgrid(y,x)
    xy = np.vstack([X.ravel(), Y.ravel()]).T
    P = model.decision_function(xy).reshape(X.shape)

    ax.contour(X, Y, P,colors="k",levels=[-1,0,1],alpha=0.5,linestyles=["--","-","--"])
    ax.set_xlim(xlim)
    ax.set_ylim(ylim)
X = np.array(X); y = np.array(y)
clf = SVC(kernel = "linear").fit(X,y)
plt.scatter(X[:,0],X[:,1],c=y,s=50,cmap="rainbow")
plot_svc_decision_function(clf)
clf.score(X,y)
0.8
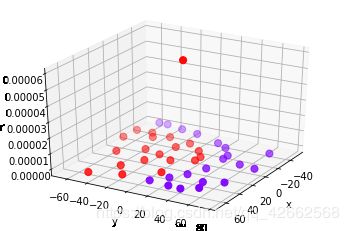
#定义一个由x计算出来的新维度r
r = np.exp(-(X**2).sum(1))

rlim = np.linspace(min(r),max(r),100)

from mpl_toolkits import mplot3d

#定义一个绘制三维图像的函数
#elev表示上下旋转的角度
#azim表示平行旋转的角度
def plot_3D(elev=30,azim=30,X=X,y=y):
    ax = plt.subplot(projection="3d")
    ax.scatter3D(X[:,0],X[:,1],r,c=y,s=50,cmap='rainbow')
    ax.view_init(elev=elev,azim=azim)
    ax.set_xlabel("x")
    ax.set_ylabel("y")
    ax.set_zlabel("r")
    plt.show()

plot_3D()
#如果放到jupyter notebook中运行
plt.scatter(X[:,0],X[:,1],c=y,s=50,cmap="rainbow")

def plot_svc_decision_function(model,ax=None):
    if ax is None:
        ax = plt.gca()
    xlim = ax.get_xlim()
    ylim = ax.get_ylim()

    x = np.linspace(xlim[0],xlim[1],30)
    y = np.linspace(ylim[0],ylim[1],30)
    Y,X = np.meshgrid(y,x)
    xy = np.vstack([X.ravel(), Y.ravel()]).T
    P = model.decision_function(xy).reshape(X.shape)

    ax.contour(X, Y, P,colors="k",levels=[-1,0,1],alpha=0.5,linestyles=["--","-","--"])
    ax.set_xlim(xlim)
    ax.set_ylim(ylim)

clf = SVC(kernel = "linear").fit(X,y)
plt.scatter(X[:,0],X[:,1],c=y,s=50,cmap="rainbow")
plot_svc_decision_function(clf)

r = np.exp(-(X**2).sum(1))

rlim = np.linspace(min(r),max(r),0.2)

from mpl_toolkits import mplot3d

def plot_3D(elev=30,azim=30,X=X,y=y):
    ax = plt.subplot(projection="3d")
    ax.scatter3D(X[:,0],X[:,1],r,c=y,s=50,cmap='rainbow')
    ax.view_init(elev=elev,azim=azim)
    ax.set_xlabel("x")
    ax.set_ylabel("y")
    ax.set_zlabel("r")
    plt.show()

# 进行交互
from ipywidgets import interact,fixed
interact(plot_3D,elev=[0,30,60,90],azip=(-180,180),X=fixed(X),y=fixed(y))
plt.show()
clf = SVC(kernel = "linear").fit(X,y)
plt.scatter(X[:,0],X[:,1],c=y,s=50,cmap="rainbow")
plot_svc_decision_function(clf)
clf.score(X,y)
1.0
# 多种核函数进行实验比较
Kernel = ["linear","poly","rbf","sigmoid"]
from sklearn import svm

fig, axes = plt.subplots(1, ncols,figsize=(20,4))

#在图像中的第一列,放置原数据的分布
ax = axes[0]
ax.set_title("Input data")
ax.scatter(X[:, 0], X[:, 1], c=y, zorder=10, cmap=plt.cm.Paired,edgecolors='k')
ax.set_xticks(())
ax.set_yticks(())

nrows=1
ncols=len(Kernel) + 1

#循环:在不同的核函数中循环
#从图像的第二列开始,一个个填充分类结果
for est_idx, kernel in enumerate(Kernel):

    #定义子图位置
    ax = axes[est_idx + 1]

    #建模
    clf = svm.SVC(kernel=kernel, gamma=2).fit(X, y)
    score = clf.score(X, y)

    #绘制图像本身分布的散点图
    ax.scatter(X[:, 0], X[:, 1], c=y
                ,zorder=10
                ,cmap=plt.cm.Paired,edgecolors='k')
    #绘制支持向量
    ax.scatter(clf.support_vectors_[:, 0], clf.support_vectors_[:, 1], s=50,
                facecolors='none', zorder=10, edgecolors='k')# facecolors='none':透明的

    #绘制决策边界
    x_min, x_max = X[:, 0].min() - .5, X[:, 0].max() + .5
    y_min, y_max = X[:, 1].min() - .5, X[:, 1].max() + .5

    #np.mgrid,合并了我们之前使用的np.linspace和np.meshgrid的用法
    #一次性使用最大值和最小值来生成网格
    #表示为[起始值:结束值:步长]
    #如果步长是复数,则其整数部分就是起始值和结束值之间创建的点的数量,并且结束值被包含在内
    XX, YY = np.mgrid[x_min:x_max:200j, y_min:y_max:200j]
    #np.c_,类似于np.vstack的功能
    Z = clf.decision_function(np.c_[XX.ravel(), YY.ravel()]).reshape(XX.shape)
    #填充等高线不同区域的颜色
    ax.pcolormesh(XX, YY, Z > 0, cmap=plt.cm.Paired)
    #绘制等高线
    ax.contour(XX, YY, Z, colors=['k', 'k', 'k'], linestyles=['--', '-', '--'],
                levels=[-1, 0, 1])

    #设定坐标轴为不显示
    ax.set_xticks(())
    ax.set_yticks(())

    #将标题放在第一行的顶上

    ax.set_title(kernel)

    #为每张图添加分类的分数
    ax.text(0.95, 0.06, ('%.2f' % score).lstrip('0')
            , size=15
            , bbox=dict(boxstyle='round', alpha=0.8, facecolor='white')
                #为分数添加一个白色的格子作为底色
            , transform=ax.transAxes #确定文字所对应的坐标轴,就是ax子图的坐标轴本身
            , horizontalalignment='right' #位于坐标轴的什么方向
            )

plt.tight_layout()
plt.show()
学习笔记
参考内容
- https://cuijiahua.com/blog/2017/11/ml_8_svm_1.html
- https://cuijiahua.com/blog/2017/11/ml_9_svm_2.html
- https://space.bilibili.com/97068901/
