python3.6 pl.legend无法显示图例,报错(legend only accepts two non-keyword arguments)
一、环境
win 10,notebook , python3.6
二、报错描述:
输出图上不显示图例
原码:
import matplotlib.pyplot as plt
import numpy as np
import pylab as pl

x1 = [1, 2, 3, 4, 5]
y1 = [1, 4, 9, 16, 25]
x2 = [1, 2, 4, 6, 8]
y2 = [2, 4, 8, 12, 16]

plot1 = pl.plot(x1, y1, 'r')
plot2 = pl.plot(x2, y2, 'go')

pl.title('Plot of y vs. x')
pl.xlabel('x axis')
pl.ylabel('y axis')


pl.xlim(0.0, 9.0)
pl.ylim(0.0, 30.)


pl.legend([plot1, plot2], ('red line', 'green circles'), 'best', numpoints=1)# make legend
pl.show()
结果:
TypeError                                 Traceback (most recent call last)
 in ()
     20
     21
---> 22 pl.legend([plot1, plot2], ('red line', 'green circles'), 'best', numpoints=1)# make legend
     23 pl.show()# show the plot on the screen

D:\anconda\lib\site-packages\matplotlib\pyplot.py in legend(*args, **kwargs)
   3742 @docstring.copy_dedent(Axes.legend)
   3743 def legend(*args, **kwargs):
-> 3744     ret = gca().legend(*args, **kwargs)
   3745     return ret
   3746

D:\anconda\lib\site-packages\matplotlib\axes\_axes.py in legend(self, *args, **kwargs)
    497                 **kwargs)
    498         if len(extra_args):
--> 499             raise TypeError('legend only accepts two non-keyword arguments')
    500         self.legend_ = mlegend.Legend(self, handles, labels, **kwargs)
    501         self.legend_._remove_method = lambda h: setattr(self, 'legend_', None)

TypeError: legend only accepts two non-keyword arguments
三、解决办法:
1、将
plot1 = pl.plot(x1, y1, 'r')
plot2 = pl.plot(x2, y2, 'go')
改为
plot1, = pl.plot(x1, y1, 'r')
plot2, = pl.plot(x2, y2, 'go')
2,
去掉 pl.legend()参数中的('red line', 'green circles'),即
将
pl.legend([plot1, plot2], ('red line', 'green circles'), 'best', numpoints=1)改为
pl.legend([plot1, plot2],['red line', 'green circles'], numpoints=1)
四、正确运行代码:
import matplotlib.pyplot as plt
import numpy as np
import pylab as pl

x1 = [1, 2, 3, 4, 5]
y1 = [1, 4, 9, 16, 25]
x2 = [1, 2, 4, 6, 8]
y2 = [2, 4, 8, 12, 16]

plot1, = pl.plot(x1, y1, 'r')
plot2, = pl.plot(x2, y2, 'go')

pl.title('Plot of y vs. x')
pl.xlabel('x axis')
pl.ylabel('y axis')


pl.xlim(0.0, 9.0)
pl.ylim(0.0, 30.)


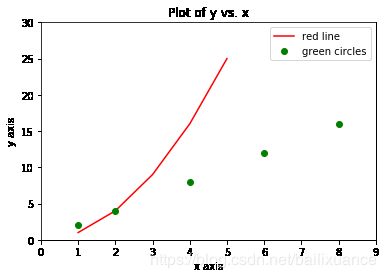
pl.legend([plot1, plot2],['red line', 'green circles'], numpoints=1)
pl.show()
结果,图例显示正常:
五、官方例程
地址:
https://matplotlib.org/users/legend_guide.html#creating-artists-specifically-for-adding-to-the-legend-aka-proxy-artists
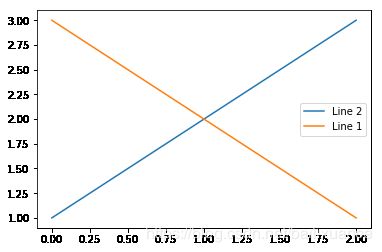
1、
import matplotlib.pyplot as plt

line_up, = plt.plot([1,2,3], label='Line 2')
line_down, = plt.plot([3,2,1], label='Line 1')
plt.legend(handles=[line_up, line_down])
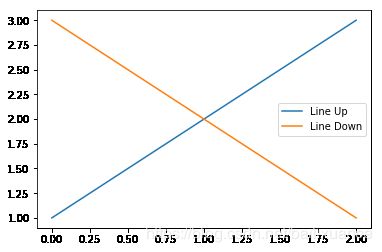
2、
import matplotlib.pyplot as plt

line_up, = plt.plot([1,2,3], label='Line 2')
line_down, = plt.plot([3,2,1], label='Line 1')
plt.legend([line_up, line_down], ['Line Up', 'Line Down'])
3、
import matplotlib.pyplot as plt


plt.subplot(211)
plt.plot([1,2,3], label="test1")
plt.plot([3,2,1], label="test2")
# Place a legend above this subplot, expanding itself to
# fully use the given bounding box.
plt.legend(bbox_to_anchor=(0., 1.02, 1., .102), loc=3,
           ncol=2, mode="expand", borderaxespad=0.)

plt.subplot(223)
plt.plot([1,2,3], label="test1")
plt.plot([3,2,1], label="test2")
# Place a legend to the right of this smaller subplot.
plt.legend(bbox_to_anchor=(1.05, 1), loc=2, borderaxespad=0.)

plt.show()


