python 学习简记 《编程导论》 CH10&CH11
《编程导论》 CH10 一些简单的算法和数据结构
10.1 搜索算法
搜索算法就是在一个元素集合中寻找具有特殊属性的一组元素。把这个元素集合称为搜索空间。
本节分析两个用于搜索列表的算法,它们都满足如下需求:
def search(L,e):
"""假定L是列表
如果e在L中返回True,否则返回False"""
语法上和Python的表达式e in L相同。
1. 线性搜索和间接访问元素
def search(L,e):
    for i in range(len(L)):
        if L[i]==e:
            return True
return False这是一种间接操作的实现技巧。使用间接操作来访问元素时会先访问另一个元素,其中包含对目标元素的引用。
访问列表中第i个元素所用的时间是常数,地址为start+4*i,算法复杂度O(len(L))
2.二分查找和利用假设
假设有一个包含整数的列表,其中的元素按升序存储。
def search(L,e):
    for i in range(len(L)):
        if L[i]==e:
            return True
        if L[i]>e:
            return False
    return False
搜索到大于e的数字就停止,这样可以降低平均运行时间,但是不会改变最坏情况下的复杂度。
def search(L,e):
    def bSearch(L,e,low,high):
        #Decrements high - low
        if high==low:
            return L[low]==e
        mid = (low+high)//2
        if L[mid]==e:
            return True
        elif L[mid]>e:
            if low==mid: #finish
                return False
            else:
                return bSearch(L,e,low,mid-1)
        else:
            return bSearch(L,e,mid+1,high)

    if len(L)==0:
        return False
    else:
return bSearch(L,e,0,len(L)-1)像search这样的函数通常称为包装函数。search函数会为用户代码提供一个优秀的接口,但是实际上并不执行真正的计算,而是用适当的参数调用辅助函数bSearch。
算法复杂度O(log(len(L)))
10.2 排序算法
利用二分查找需要先排序,如果需要搜索统一个列表多次(k次),那可以先对列表进行一次排序操作,当满足:
(sortComplexity(L)+k*log(len(L)))
Python内建的排序算法足够高效O(nlog(n)): L.sort()对列表排序 sorted(L)返回的列表和L包含相同的元素而不修改L
选择排序:
选择排序会保持一个循环不变式:将列表分割成前一部分(L[0:i])和后一部分(L[i+1:len(L)]),前一部分是有序的,并且其中的所有元素都不大于后一部分中的最小元素。
def selSort(L):
    """assume L is a list,and elements could be compared by >,ascending sort"""
    suffixStart =0
    while suffixStart != len(L):
        prefixEnd=suffixStart #书上没这句 编译不通过?
        for i in range(prefixEnd,len(L)):
if L[i]1.归并排序
前面说的二分查找是分治算法的一种。
分治算法可以被描述为:
1)一个输入大小的阈值,输入大小低于这个值的问题不会被分解;
2)子问题的大小和数量,据此对问题进行分解;
3)用来合并子结果的算法
阈值有时候被称为递归基础。
归并排序是一种典型的分治算法:
1)如果列表的长度是0或者1,那已经是有序的。
2)如果列表包含超过一个元素,将它分成两个列表,然后使用归并排序来分别对他们进行排序
3)合并结果
两个有序的列表可以高效地合并为一个有序的列表:查看两个列表的第一个元素,将较小的一个元素移动到结果列表的结尾。当其中一个列表为空时,将另一个列表中剩余的元素全部复制到结果列表。
合并过程复杂度:O(len(L1)+len(L2))
def merge(left,right,compare):
    result =[]
    i,j=0,0
    while i
时间复杂度O(n*log(n))
空间复杂度O(len(L))
2.把函数当作参数
排序人名列表:
def lastNameFirstName(name1,name2):
import string
name1=string.split(name1,' ')
name2=string.split(name2,' ')
if name1[1]!=name2[1]:
return name1[1] Sorted by first name = ['Chris Terman', 'Eric Grimson', 'Gisele Bundchen', 'Tom Brady']
3.Python中的排序
Python中大多数实现中使用的排序算法被称为timsort。关键思想就是利用这样一个事实:大多数数据集中的数据已经是部分有序的。timsort在最坏情况下的性能和归并排序相同。但是它的平均性能比归并排序要好。
Python的list.sort方法接受一个列表作为它的第一个参数并直接对列表进行修改。(字典没有此方法)
Python的函数sorted可以接受一个可迭代的元素(例如,一个列表或一个字典)作为它的第一个参数并返回一个有序的新列表。
list.sort方法和sorted函数都可以有两个附加参数。参数key和我们归并排序的实现中compare参数作用一样:它会被当作比较函数。参数reverse指定列表是按照升序还是降序进行排序。
L=[[1,2,3],(3,2,1,0),'abc']
print sorted(L,key = len,reverse = True)
输出:
[(3, 2, 1, 0), [1, 2, 3], 'abc']
list.sort方法和sorted函数都保证稳定排序(stable sorts)
10.3 散列表
下例使用一个简单的散列函数实现了键为整数的字典
class intDict(object):
def __init__(self,numBuckets):
self.buckets=[]
self.numBuckets = numBuckets
for i in range(numBuckets):
self.buckets.append([])
def addEntry(self,dictKey,dictVal):
"""assume dictKey is an int, add an entry"""
hashBucket = self.buckets[dictKey%self.numBuckets]
for i in range(len(hashBucket)):
if hashBucket[i][0] == dictKey:
hashBucket[i]=(dictKey,dictVal)
return
hashBucket.append((dictKey,dictVal))
def getValue(self,dictKey):
hashBucket = self.buckets[dictKey%self.numBuckets]
for e in hashBucket:
if e[0] == dictKey:
return e[1]
return None
def __str__(self):
result = '{'
for b in self.buckets:
for e in b:
result = result+str(e[0])+':'+str(e[1])+','
return result[:-1]+'}'#delete the last comma
import random
D = intDict(29)
for i in range(20):
key = random.randint(0,10**5)
D.addEntry(key,i)
print 'The value of the intDict is:'
print D
print '\n','The buckets are:'
for hashBucket in D.buckets:
print ' ',hashBucket
输出结果:
The value of the intDict is:
{99270:19,55598:6,50147:4,1717:10,11984:3,15581:2,52962:8,33880:16,89825:17,15644:0,71006:11,85159:9,76836:13,55927:18,70748:5,56368:7,50772:1,3647:12,78324:15,57969:14}
The buckets are:
[]
[]
[]
[(99270, 19)]
[]
[(55598, 6)]
[(50147, 4), (1717, 10)]
[(11984, 3)]
[(15581, 2), (52962, 8), (33880, 16)]
[]
[]
[]
[(89825, 17)]
[(15644, 0)]
[(71006, 11)]
[(85159, 9), (76836, 13), (55927, 18)]
[]
[(70748, 5)]
[]
[]
[]
[(56368, 7)]
[(50772, 1), (3647, 12)]
[]
[(78324, 15)]
[]
[]
[(57969, 14)]
[]
当散列表足够大时复杂度可为O(1)
CH11 绘图以及类的拓展内容
注:PyLab不是Python里面装一个包就完了的,要装好多组件,昨天费了好大劲终于装好了,可以参考http://blog.csdn.net/huigeng0627/article/details/51824775
11.1 使用PyLab绘图
PyLab是Python的一个标准库,提供了MATLAB的许多功能。MATLAB是“一种高级的技术性计算语言和交互环境,用于算法开发、数据可视化、数据分析和数值运算”。本章只关注PyLab的绘制数据功能。
完整PyLab用户指南可以参考:matplotlib.sourceforge.net/users/index.html
首先使用pylab.plot生成两张图
import pylab
pylab.figure(1)
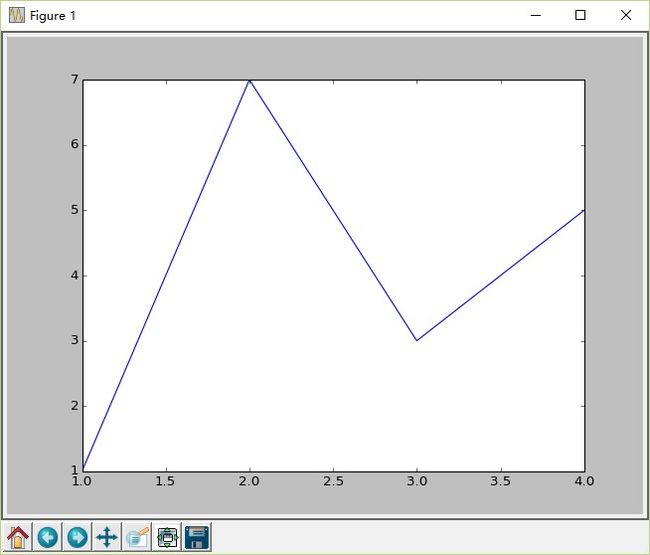
pylab.plot([1,2,3,4],[1,7,3,5])
pylab.show()
![]()
最后一行代码pylab.show()会产生屏幕上的这个窗口。如果没有这行代码,图本身仍然会被生成,但是不会被显示出来。
窗口底部有一些按钮。最右侧的按钮用来把图写入文件中。它左侧的按钮用来调节窗口中图的外观。再往左的四个按钮用来对图执行移动和缩放操作。当执行了移动或者缩放操作之后,可以使用最左侧的按钮把图还原到初始状态。
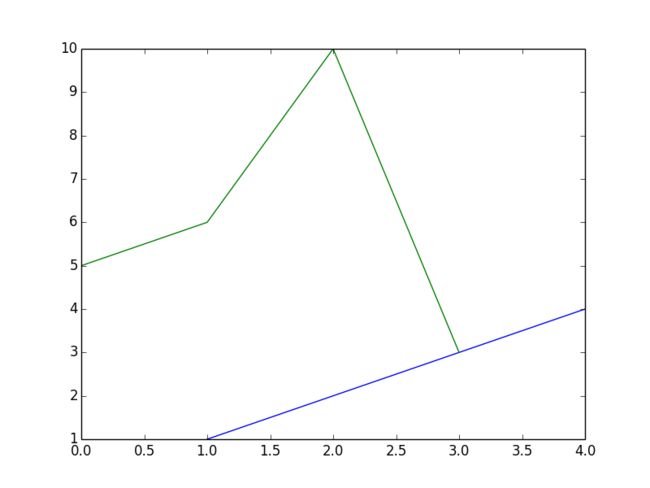
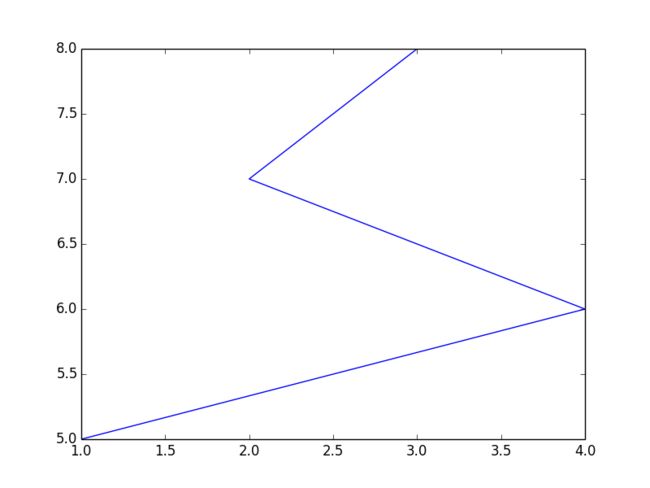
可以生成多张图并把它们写入文件中。文件名可以自定义,但是拓展名会是.png,表示文件的格式是便携式网络图形(portable networks graphic)。这是公共领域的图像表示标准。
上面的代码会生成以上两张图,并保存到文件Figure-Jane.png和Figure-Addie.png中。
上例中最后一个pylab.plot调用只传入了一个参数。这个参数表示y值,对应的x值默认是range(len([5,6,10,3])),因此本例中x值的范围是0~3.
PyLab中有一个概念叫做“当前图”。执行语句pylab.figure(x)会把第x个图设置为当前图。之后执行的PyLab命令都会应用在这个图上,直到运行另一个pylab.figure命令。
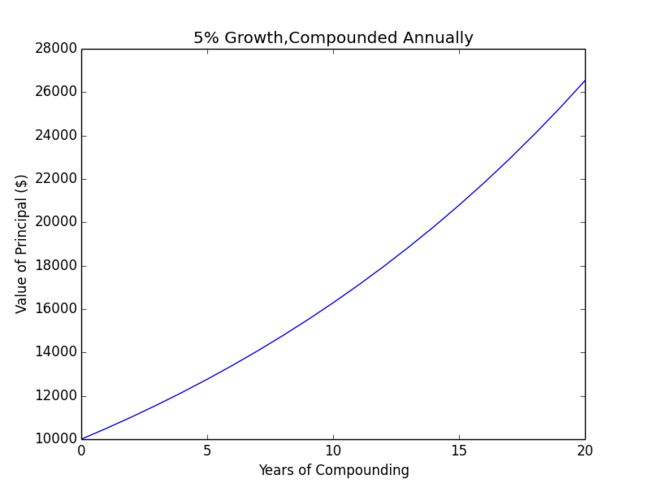
principal = 10000 #init compounding
interestRate = 0.05
years = 20
values = []
for i in range(years + 1):
values.append(principal)
principal+=principal*interestRate
pylab.plot(values)
pylab.title('5% Growth,Compounded Annually')
pylab.xlabel('Years of Compounding')
pylab.ylabel('Value of Principal ($)')
pylab.savefig('p1')

绘制曲线的时候可以传入一个可选的参数,这个参数是一个格式化字符串,表示曲线的颜色和类型。格式化字符串中的字母和符号都来自MATLAB,由一个颜色标识符和一个线条类型标识符组合而成。默认的格式化字符串是‘b-',表示一条蓝色的实线。如果要画红色圆点,可以用pylab.plot(values,'ro')来代替pylab.plot(values)。
完整的颜色和线条风格标识符可以查看http://matplotlib.sourceforge.net/api/pyplot_api.html#matplotlib.pyplot.plot。
也可以改变图中的字体大小和线条宽度。在具体的命令中使用关键字参数就可以了。
principal = 10000 #init compounding
interestRate = 0.05
years = 20
values = []
for i in range(years + 1):
values.append(principal)
principal+=principal*interestRate
pylab.plot(values,linewidth= 30) #线条变粗
pylab.title('5% Growth,Compounded Annually',fontsize = 'xx-large') #字变大
pylab.xlabel('Years of Compounding',fontsize = 'x-small') #字变小
pylab.ylabel('Value of Principal ($)')
pylab.savefig('p1')
如果愿意的话也可以修改默认值,它们也被称为“rc设置”。默认值被存储在一个类似字典的变量中,可以通过pylab.rcParams访问。比如可以执行代码
pylab.rcParams['lines.linewidth']=6把默认的线条宽度设置为6点。
查看完整的自定义设置教程, 可以访问:
http://matplotlib.sourceforge.net/users/customizing.html
11.2 拓展实例:绘制抵押贷款
__author__ = 'sunzhaoyue'
import pylab
def findPayment(loan,r,m):
"""assume:loan and r are float,m is an integer
return the money should be refunded when the num of money loaned is loan,
monthly interest is r in total m months"""
return loan*((r*(1+r)**m)/((1+r)**m-1))
#有绘图方法的Mortage类
class Mortgage(object):
"""an abstract class to construct different types of mortgage"""
def __init__(self,loan,annRate,months):
self.loan = loan
self.rate = annRate/12.0
self.months = months
self.paid = [0.0]
self.owed = [loan]
self.payment = findPayment(loan,self.rate,months)
self.legend = None #description of mortage
def makePayment(self):
"""refund"""
self.paid.append(self.payment)
reduction = self.payment - self.owed[-1]*self.rate
self.owed.append(self.owed[-1] - reduction)
def getTotalPaid(self):
"""return num of money has been repaid now"""
return sum(self.paid)
def __str__(self):
return self.legend
#使用键在一张图中表示多图
def plotPayments(self,style):
pylab.plot(self.paid[1:],style,lable=self.legend)
def plotBalance(self,style):
pylab.plot(self.owed,style,label = self.legend)
#绘制还款总额的变化
def plotTotPd(self,style):
totPd = [self.paid[0]]
for i in range(1,len(self.paid)):
totPd.append(totPd[-1] + self.paid[i])
pylab.plot(totPd,style,label = self.legend)
#绘制抵押贷款大致的总支出
#把列表转换成数组类型(pylab.array)可以结合数学运算符进行操作
def plotNet(self,style):
totPd = [self.paid[0]]
for i in range(1,len(self.paid)):
totPd.append(totPd[-1] + self.paid[i])
equityAcquired = pylab.array([self.loan]*len(self.owed))
equityAcquired = equityAcquired - pylab.array(self.owed)
net = pylab.array(totPd) - equityAcquired
pylab.plot(net,style,label = self.legend)
#Mortage的子类
class Fixed(Mortgage):
def __init__(self,loan,r,months):
Mortgage.__init__(self,loan,r,months)
self.legend = 'Fixed, '+str(r*100)+ '%'
class FixedWithPts(Mortgage):
def __init__(self,loan,r,months,pts):
Mortgage.__init__(self,loan,r,months)
self.pts = pts
self.paid = [loan*(pts/100.0)]
self.legend = 'Fixed, '+str(r*100)+'%, '+str(pts)+' points'
class TwoRate(Mortgage):
def __init__(self,loan,r,months,teaserRate,teaserMonths):
Mortgage.__init__(self,loan,teaserRate,months)
self.teaserMonths = teaserMonths
self.teaserRate = teaserRate
self.nextRate = r/12.0
self.legend = str(teaserRate*100) + '% for'+str(self.teaserMonths)+' months, then'+str(r*100)+'%'
def makePayment(self):
if len(self.paid)==self.teaserMonths+1:
self.rate = self.nextRate
self.payment = findPayment(self.owed[-1],self.rate,self.months-self.teaserMonths)
Mortgage.makePayment(self)
#生成抵押贷款曲线
def plotMortgages(morts,amt):
styles = ['b-','b-.','b:']
#Give names to figure numbers
payments = 0
cost = 1
balance = 2
netCost = 3
pylab.figure(payments)
pylab.title('Monthly Payments of Different $'+str(amt)+' Mortgages')
pylab.xlabel('Months')
pylab.ylabel('Monthly Payments')
pylab.figure(cost)
pylab.title('Cash Outlay of Different $'+str(amt) + ' Mortgages')
pylab.xlabel('Months')
pylab.ylabel('Total Payments')
pylab.figure(balance)
pylab.title('Balance Remaining of $'+str(amt) + ' Mortgages')
pylab.xlabel('Months')
pylab.ylabel('Payments - Equity $')
for i in range(len(morts)):
pylab.figure(payments)
morts[i].plotPayments(styles[i])
pylab.figure(cost)
morts[i].plotTotPd(styles[i])
pylab.figure(balance)
morts[i].plotBalance(styles[i])
pylab.figure(netCost)
morts[i].plotNet(styles[i])
pylab.figure(payments)
pylab.legend(loc = 'upper center')
pylab.figure(cost)
pylab.legend(loc = 'best')
pylab.figure(balance)
pylab.legend(loc = 'best')
def compareMortgages(amt,years,fixedRate,pts,ptsRate,varRate1,varRate2,varMonths):
totMonths = years*12
fixed1 = Fixed(amt, fixedRate, totMonths)
fixed2 = FixedWithPts(amt, ptsRate, totMonths, pts)
twoRate = TwoRate(amt, varRate2, totMonths, varRate1, varMonths)
morts = [fixed1,fixed2,twoRate]
for m in range(totMonths):
for mort in morts:
mort.makePayment()
#调用
compareMortgages(amt=200000, years=30, fixedRate=0.07, pts=3.25,
ptsRate=0.05, varRate1=0.045, varRate2=0.095, varMonths=48)


