时间序列之数据处理
时间序列
- 时间戳(timestamp)
- 固定周期(period)
- 时间间隔(interval)
(都是基于pandas)
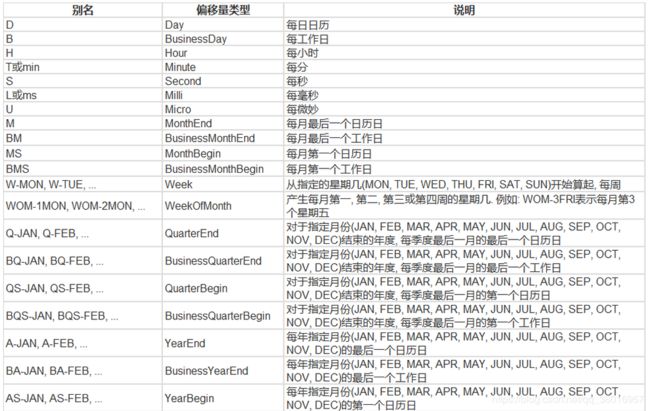
1、date_range
- 可以指定开始时间与周期
- H:小时
- D:天(默认)
- M:月
时间格式:
- 2016 Jul 1
- 7/1/2016
- 1/7/2016
- 2016-07-01
- 2016/07/01
用法一:按间隔生成时间序列
IN:
rng = pd.date_range('2016-07-01', periods = 10, freq = '3D')#还可1D1H一天一小时
#'2016-07-01'为开始时间,周期为10,间隔为‘3D’-3天
OUT:
DatetimeIndex(['2016-07-01', '2016-07-04', '2016-07-07', '2016-07-10',
               '2016-07-13', '2016-07-16', '2016-07-19', '2016-07-22',
               '2016-07-25', '2016-07-28'],
              dtype='datetime64[ns]', freq='3D')
用法二:生成以时间为index的序列
IN:
time=pd.Series(np.random.randn(20),
           index=pd.date_range(dt.datetime(2016,1,1),periods=20))
OUT:
2016-01-01   -0.129379
2016-01-02    0.164480
2016-01-03   -0.639117
2016-01-04   -0.427224
2016-01-05    2.055133
2016-01-06    1.116075
2016-01-07    0.357426
2016-01-08    0.274249
2016-01-09    0.834405
2016-01-10   -0.005444
2016-01-11   -0.134409
2016-01-12    0.249318
2016-01-13   -0.297842
2016-01-14   -0.128514
2016-01-15    0.063690
2016-01-16   -2.246031
2016-01-17    0.359552
2016-01-18    0.383030
2016-01-19    0.402717
2016-01-20   -0.694068
Freq: D, dtype: float64
用法三:给定开始和结束时间,按周期生成序列
IN:
data=pd.date_range('2010-01-01','2011-01-01',freq='M')
OUT:
DatetimeIndex(['2010-01-31', '2010-02-28', '2010-03-31', '2010-04-30',
               '2010-05-31', '2010-06-30', '2010-07-31', '2010-08-31',
               '2010-09-30', '2010-10-31', '2010-11-30', '2010-12-31'],
              dtype='datetime64[ns]', freq='M')
2、truncate时间过滤
现对用法二中的time做过滤
IN:
    #time before  或者 after都是一样的
    time.truncate(before='2016-1-10')
OUT:
2016-01-10   -0.005444
2016-01-11   -0.134409
2016-01-12    0.249318
2016-01-13   -0.297842
2016-01-14   -0.128514
2016-01-15    0.063690
2016-01-16   -2.246031
2016-01-17    0.359552
2016-01-18    0.383030
2016-01-19    0.402717
2016-01-20   -0.694068
Freq: D, dtype: float64
其他操作:
#选择规定时间之内的值
time['2016-01-15':'2016-01-20']

#时间戳:选择某个时间(唯一的)
pd.Timestamp('2016-07-10 10:15')

#查看时间所属区间属于天还是月、、
pd.Period('2016-01')
pd.Period('2016-01-01')

#对时间的操作-相加
pd.Timestamp('2016-01-01 10:10') + pd.Timedelta('1 day')
3、resample时间重采样
- 时间数据由一个频率转换到另一个频率
- 降采样 (减小时间间隔)
- 升采样 (由月升天,增大时间间隔)
#先按天随机生成时间序列
rng = pd.date_range('1/1/2011', periods=90, freq='D')
ts = pd.Series(np.random.randn(len(rng)), index=rng)

#由天转换为按月观察数据的一些指标
#sum、mean、
ts.resample('M').sum()#对一个月所有值求和
ts.resample('M').mean()#对一个月所有值求均值
in:
#现将’D‘降为’3D‘
day3Ts = ts.resample('3D').mean()
out:
2011-01-01    0.045643
2011-01-04   -2.255206
2011-01-07    0.571142
2011-01-10    0.835032
若由‘3D’此时观察’D’,一些数据是空缺的
print(day3Ts.resample('D').asfreq())
out:
2011-01-01    0.015214
2011-01-02         NaN
2011-01-03         NaN
2011-01-04   -0.751735
2011-01-05         NaN
2011-01-06         NaN
2011-01-07    0.190381
2011-01-08         NaN
2011-01-09         NaN
2011-01-10    0.278344
2011-01-11         NaN
2011-01-12         NaN
可采用插值法:
插值方法:
- ffill 空值取前面的值
- bfill 空值取后面的值
- interpolate 线性取值
in:
 #用前面的值填充一个NaN
 day3Ts.resample('D').ffill(1)
out:
2011-01-01    0.015214
2011-01-02    0.015214
2011-01-03         NaN
2011-01-04   -0.751735
2011-01-05   -0.751735
2011-01-06         NaN
2011-01-07    0.190381
2011-01-08    0.190381
2011-01-09         NaN
in:
#将不空缺的两个数据连线,NaN则取对于线上的值
day3Ts.resample('D').interpolate('linear')
out:
2011-01-01    0.015214
2011-01-02   -0.240435
2011-01-03   -0.496085
2011-01-04   -0.751735
2011-01-05   -0.437697
2011-01-06   -0.123658
4、滑动窗口
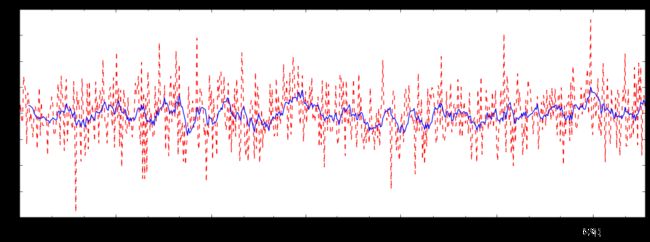
当取一年中某一天的值的时候,往往会有异常点,为了取得的值更加靠谱,采用滑动窗口,对某一天的前后几天取均值再赋值给这一天。
#先随机生成时间序列
df = pd.Series(np.random.randn(600), index = pd.date_range('7/1/2016', freq = 'D', periods = 600))

r = df.rolling(window = 10)
#center这一天为中心,去左右的十天均值(窗口大小)
#Rolling [window=10,center=False,axis=0]
、
#现将效果plot出来
import matplotlib.pyplot as plt
%matplotlib inline

plt.figure(figsize=(15, 5))

df.plot(style='r--')
df.rolling(window=10).mean().plot(style='b')

