Echart自定义图片绘制热力图实现图片适配
可能你会有这样的需求,在一张场景的图片上,通过热力图的形式直观的展示热点区域,如果你使用的是echart图表,那这个可能会给帮助,如此让我们一起去用echart的地理坐标自定义的实现一个以图片背景,实现一个热力图。
开发准备
技术上因为我项目上使用的是react编程、因此对echart做了简单的封装处理,对于图表渲染这里的实现可能和官方demo略有一点区别。实现自定义图片绘制热力图时参考了ehcart社区demo(2d-自定义地图实现热力图),该demo基本实现想要的样子,但是demo绘制的背景图是反面倒立成像的,并不满足热力图成像的规则。
开发需求及痛点
- 网络获取图片背景素材绘制热力图层
- 图片尺寸大小不固定,容器为定宽
具体实现
认识地理坐标系组件geo。
简单介绍下地理坐标系组件用于地图的绘制,支持在地理坐标系上绘制散点图,线集。
开发流程如下
1.图片加载
2.地图注册
3.设置option
- 图片加载。
image图片加载,在canvas上的绘制有两个需要注意的地方,图片加载中的跨域问题。
(unknown) Uncaught DOMException: Failed to execute 'toDataURL' on 'HTMLCanvasElement': Tainted canvases may not be exported.
首先并不是说 canvas 使用的 image 不能跨域,而是说 canvas 使用了没有权限的跨域图片在使用 canvas.toDataURL()等数据导出函数的时候会报错。修改代码如下
image.setAttribute("crossOrigin",'Anonymous');
image.src = '图片路径';
其实就是那个 img.crossOrigin = “Anonymous” 做了巨大的贡献,它开启了本地的跨域允许。当然服务器存储那边也要开放相应的权限才行,如果是设置了防盗链的图片在服务端就没有相应的权限的话本地端设置了这个属性开启权限也是没有用的,需要服务端开启跨域支持。
![]()
图片绘制的缩放,根据缩放比剪切图像,并在画布上定位被剪切的部分,相关api:
context.drawImage(img,sx,sy,swidth,sheight,x,y,width,height);
参数值
参数 描述
img 规定要使用的图像、画布或视频。
sx 可选。开始剪切的 x 坐标位置。
sy 可选。开始剪切的 y 坐标位置。
swidth 可选。被剪切图像的宽度。
sheight 可选。被剪切图像的高度。
x 在画布上放置图像的 x 坐标位置。
y 在画布上放置图像的 y 坐标位置。
width 可选。要使用的图像的宽度。(伸展或缩小图像)
height 可选。要使用的图像的高度。(伸展或缩小图像)
代码实现相关片段
   const that= this;
    var image = new Image();
    var canvas = document.createElement('canvas');
    var ctx = canvas.getContext('2d');
    var fullImage = new Image();
    var zoom =1;//缩放比例
    const containerWidth = this.chartnode.offsetWidth;
    image.onload = function() {
        zoom = (image.width > containerWidth) ? image.width/containerWidth:1;
        canvas.width=image.width/zoom;
        canvas.height=image.height/zoom;
        ctx.drawImage(image, 0, 0, image.width,image.height,0,0,canvas.width, canvas.height);
        fullImage.src = canvas.toDataURL();
    }
    image.setAttribute("crossOrigin",'Anonymous');
    image.src = imgSrc;
缩放比例:根据容器的大小,来缩放图片,最初我的想法是根据计算出的缩放比,通过处理数据源,来实现canvas的绘制,然后发现对与热力图数据,数据量比较庞大的基础上,处理数据带来客户端性能上非常差的体验,然后使用了css3的新特性,根据容器比例缩放。
if (that.chartnode) {
      that.chartnode.setAttribute(
        "style",
        "-webkit-transform: scale(" + zoom + ");-webkit-transform-origin:0 0;"
      );
 }
- 地图注册
var geoMapName = 'geoMap' + Math.round(Math.random() * 1E10);
var features = {
    "type": "FeatureCollection",
    "features": [{
        "type": "Feature",
        "properties": {
            "name": geoMapName
        },
        "geometry": {
            "type": "MultiPolygon",
            "coordinates": [
                [
                    [
                       [0, 0],
                       [fullImage.width, 0],
                       [fullImage.width, fullImage.height],
                       [0, fullImage.height],
                    ]
                ]
            ]
        }
    }]
};
echarts.registerMap(geoMapName, features);
- option设置
option = {
   backgroundColor: {
            type: "pattern",
            repeat: "no-repeat",
            image: fullImage,
   },
   geo: {
              map: geoMapName,
              show:false,
              aspectScale: 1, // 宽高比
              silent: true,
              roam: false,
              left:0,
              top:0,
              width:fullImage.width,
              height:fullImage.height,
            //   itemStyle: {
            //       borderWidth: 0,
            //       areaColor: {
            //           type: 'pattern',
            //           image: fullImage, // 支持为 HTMLImageElement, HTMLCanvasElement,不支持路径字符串
            //           repeat: 'no-repeat' // 是否平铺, 可以是 'repeat-x', 'repeat-y', 'no-repeat'
            //       }
            //   },
          },
   visualMap: {
        show: false,
        right: 35,
        bottom: 0,
        itemWidth: 10,
        itemHeight: 100,
        hoverLink: false,
        inRange: {
            color: ['blue', 'blue', 'green', 'yellow', 'red']
        }
    },
    series: [{
        type: 'heatmap',
        coordinateSystem: 'geo',
        pointSize: 15,
        blurSize: 15,
        data: [
            [121.15, 31.89, 9],
            [109.781327, 39.608266, 12],
            [120.38, 37.35, 12],
            [122.207216, 29.985295, 12],
            [123.97, 47.33, 14],
            [120.13, 33.38, 15],
            [118.87, 42.28, 16],
            [120.33, 36.07, 18],
            [121.52, 36.89, 18],
            [102.188043, 38.520089, 19],
            [118.58, 24.93, 21],
            [120.53, 36.86, 21],
            [119.46, 35.42, 21],
            [119.97, 35.88, 22],
            [121.05, 32.08, 23],
            [91.11, 29.97, 24]
        ],
    }]
}
最后得絮叨絮叨社区demo坑了,还是从geo组件开始,代码片段:
            //   itemStyle: {
            //       borderWidth: 0,
            //       areaColor: {
            //           type: 'pattern',
            //           image: fullImage, // 支持为 HTMLImageElement, HTMLCanvasElement,不支持路径字符串
            //           repeat: 'no-repeat' // 是否平铺, 可以是 'repeat-x', 'repeat-y', 'no-repeat'
            //       }
            //   },
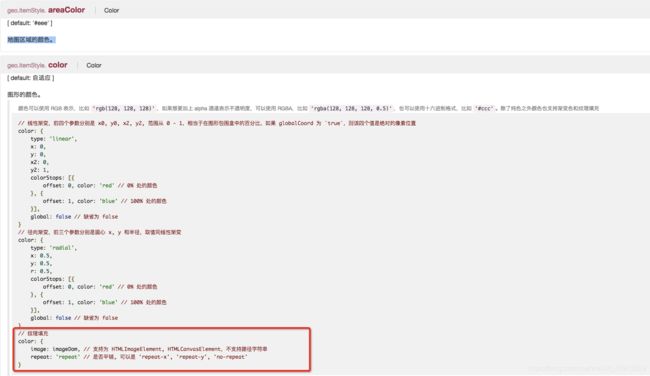
itemStyle:官方解释为地图区域的多边形 图形样式,areaColor为设置地图区域的颜色。

项目优化体验
不得不说的是纹理填充,填充后的图片为反面倒立。这真是难受了一笔。。如果这个功能能正常显示的话,体验效果上会背景的图实现的方式好上不少,但是无奈,花费了好长时间,琢磨了一下午的配置手册文档,也没有找到这个奇怪的问题产生的原因,如果你有问题这个的解决方案,请不吝指教。
既然最后没有实现使用地理坐标系,填充文理的效果,那么背景图的方式可能更加适合,减少了图片转换及canvas绘制的成本。